
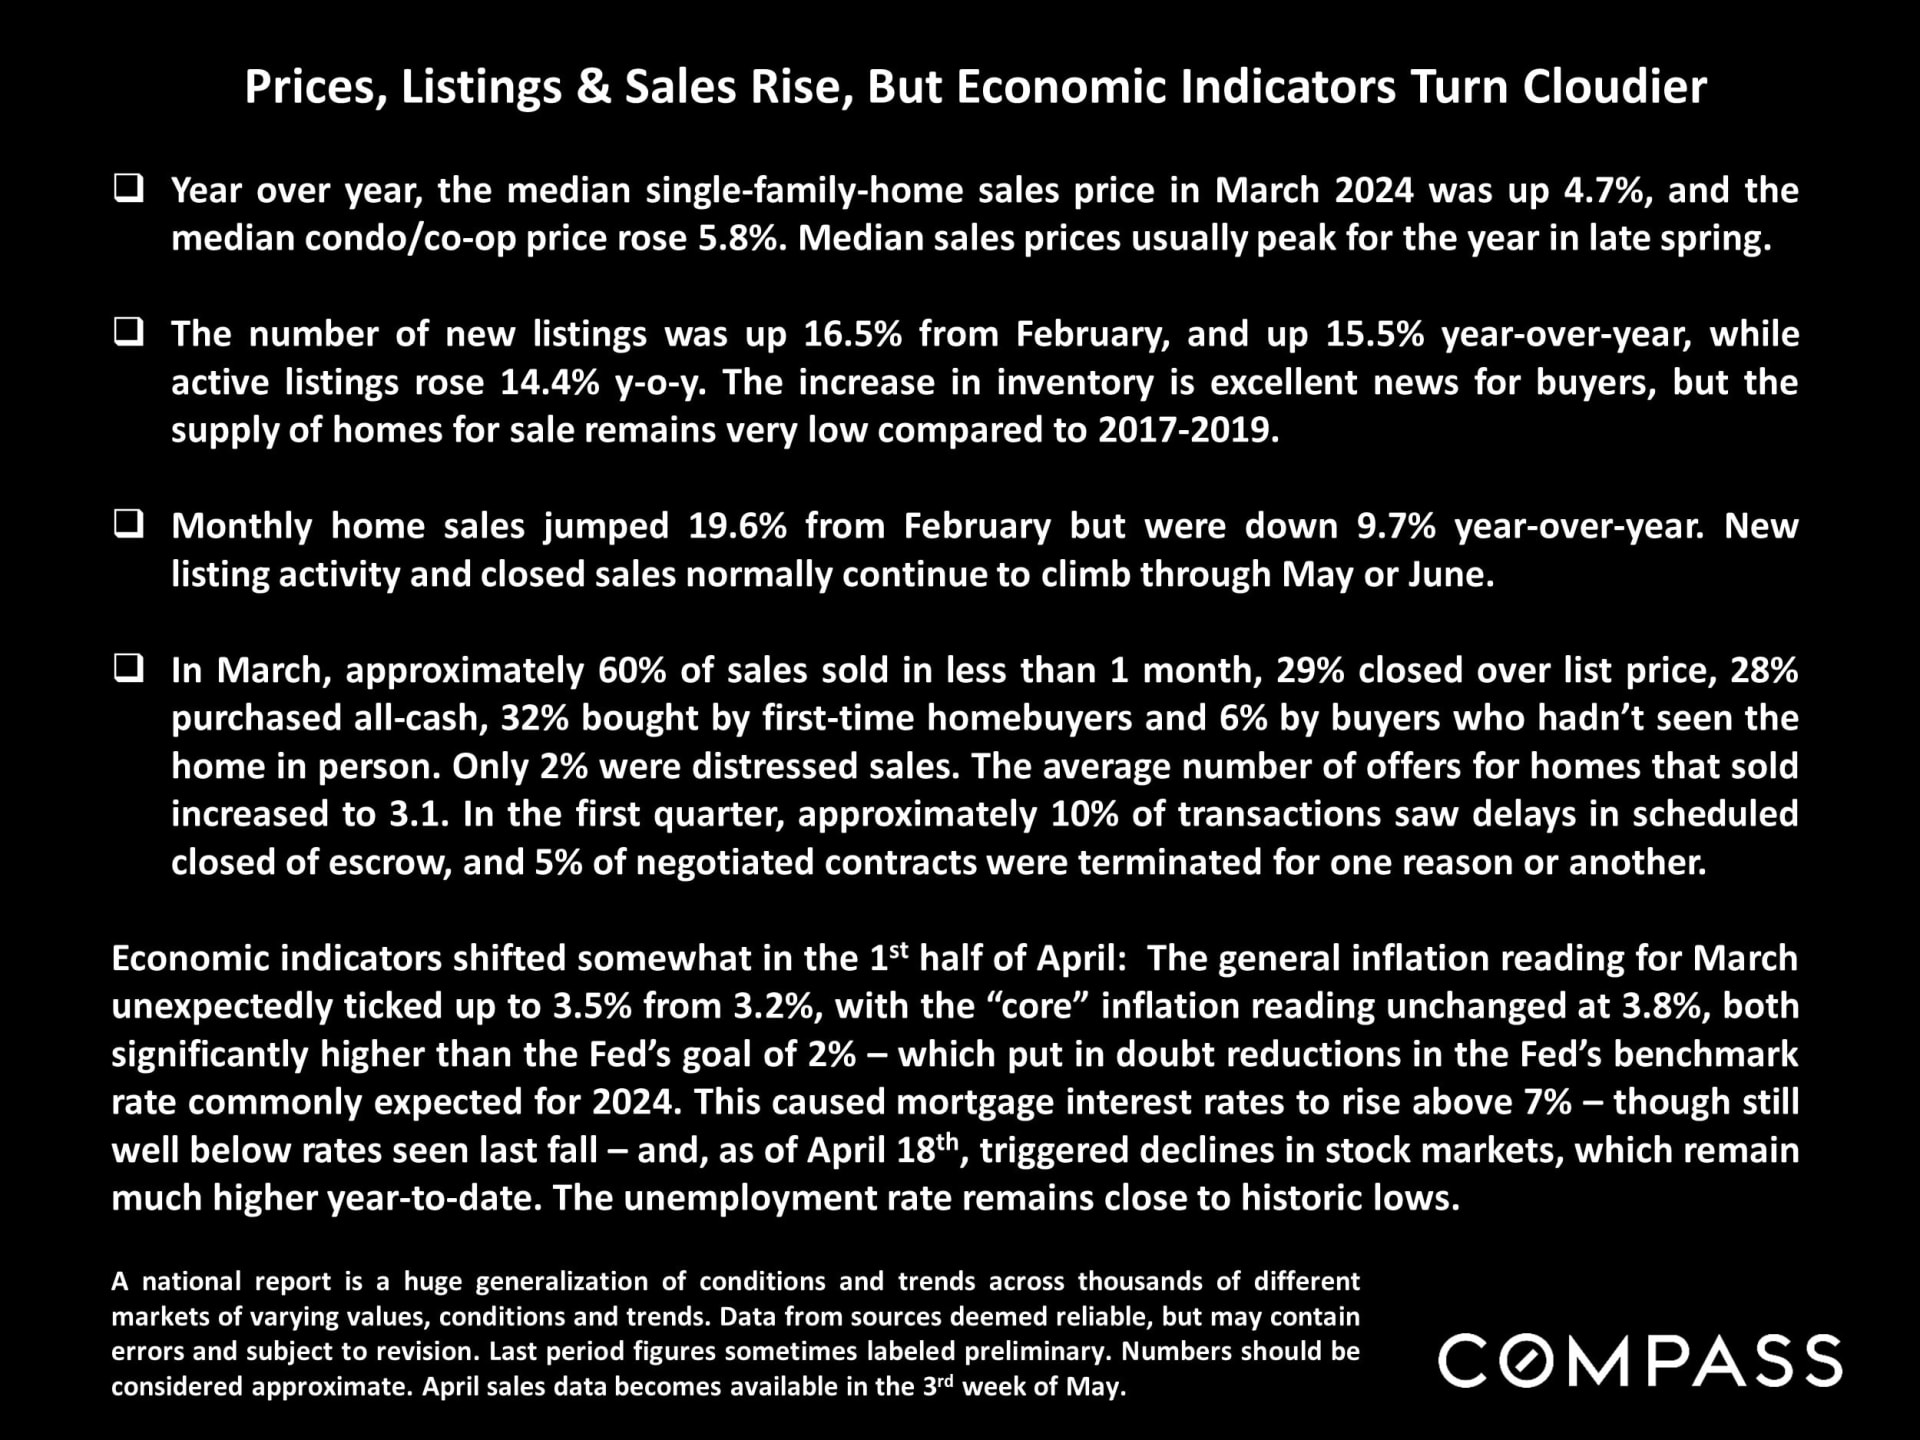
The U.S. median house sales price increased in March and will almost certainly
continue to rise in coming months. Its all-time high occurred in June 2022. 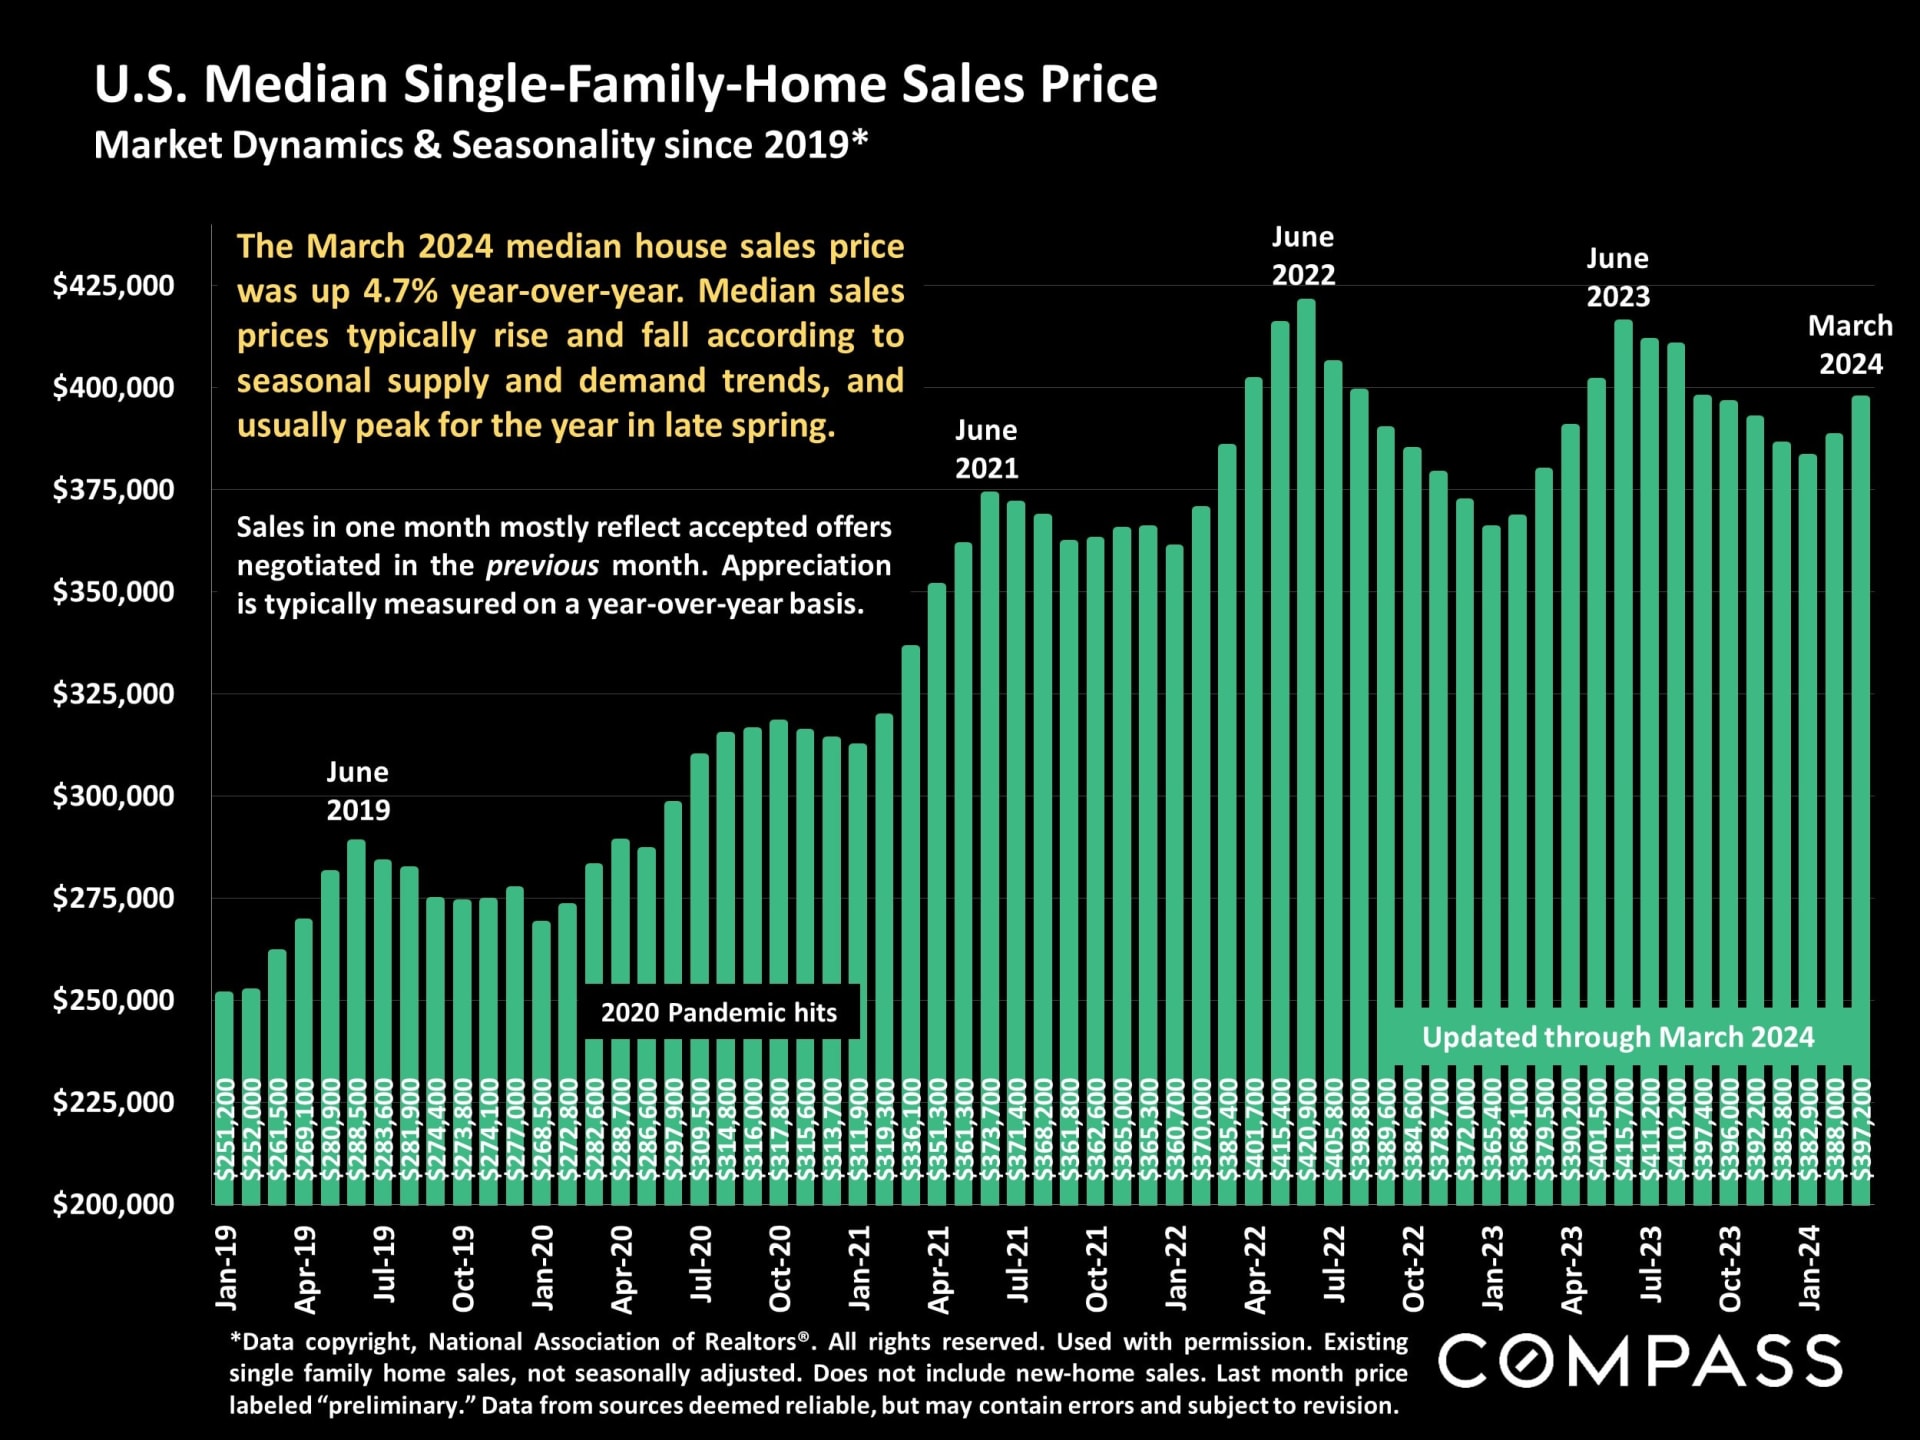
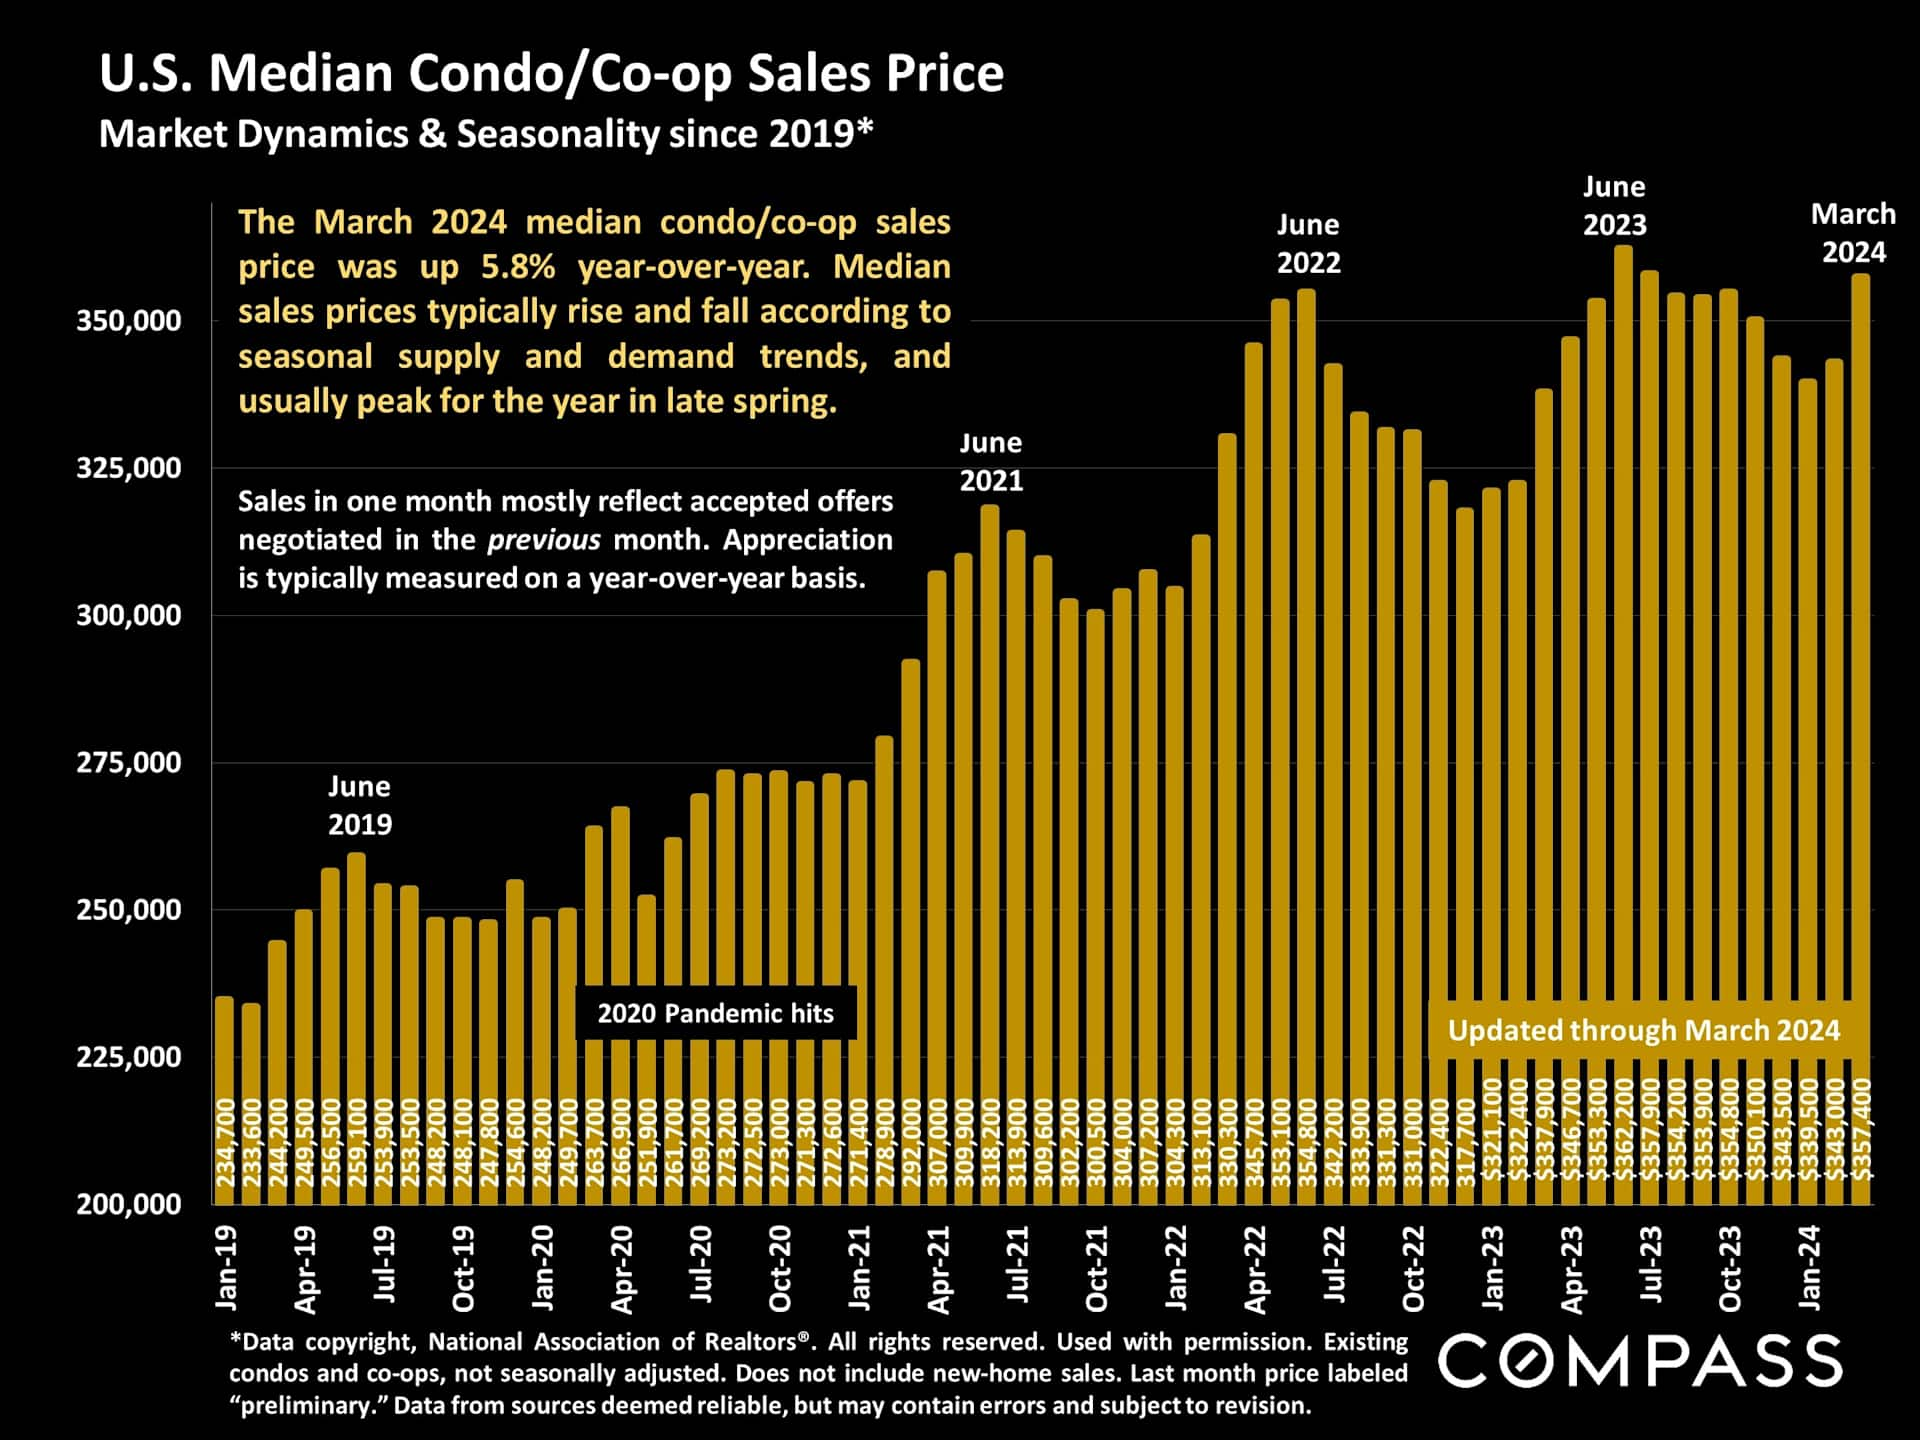
The median condo/co-op sales price jumped from February, and rose on a year-over-year basis. Its all-time high was in June 2023, but, on current trends, it appears that may be surpassed in Q2 2024.
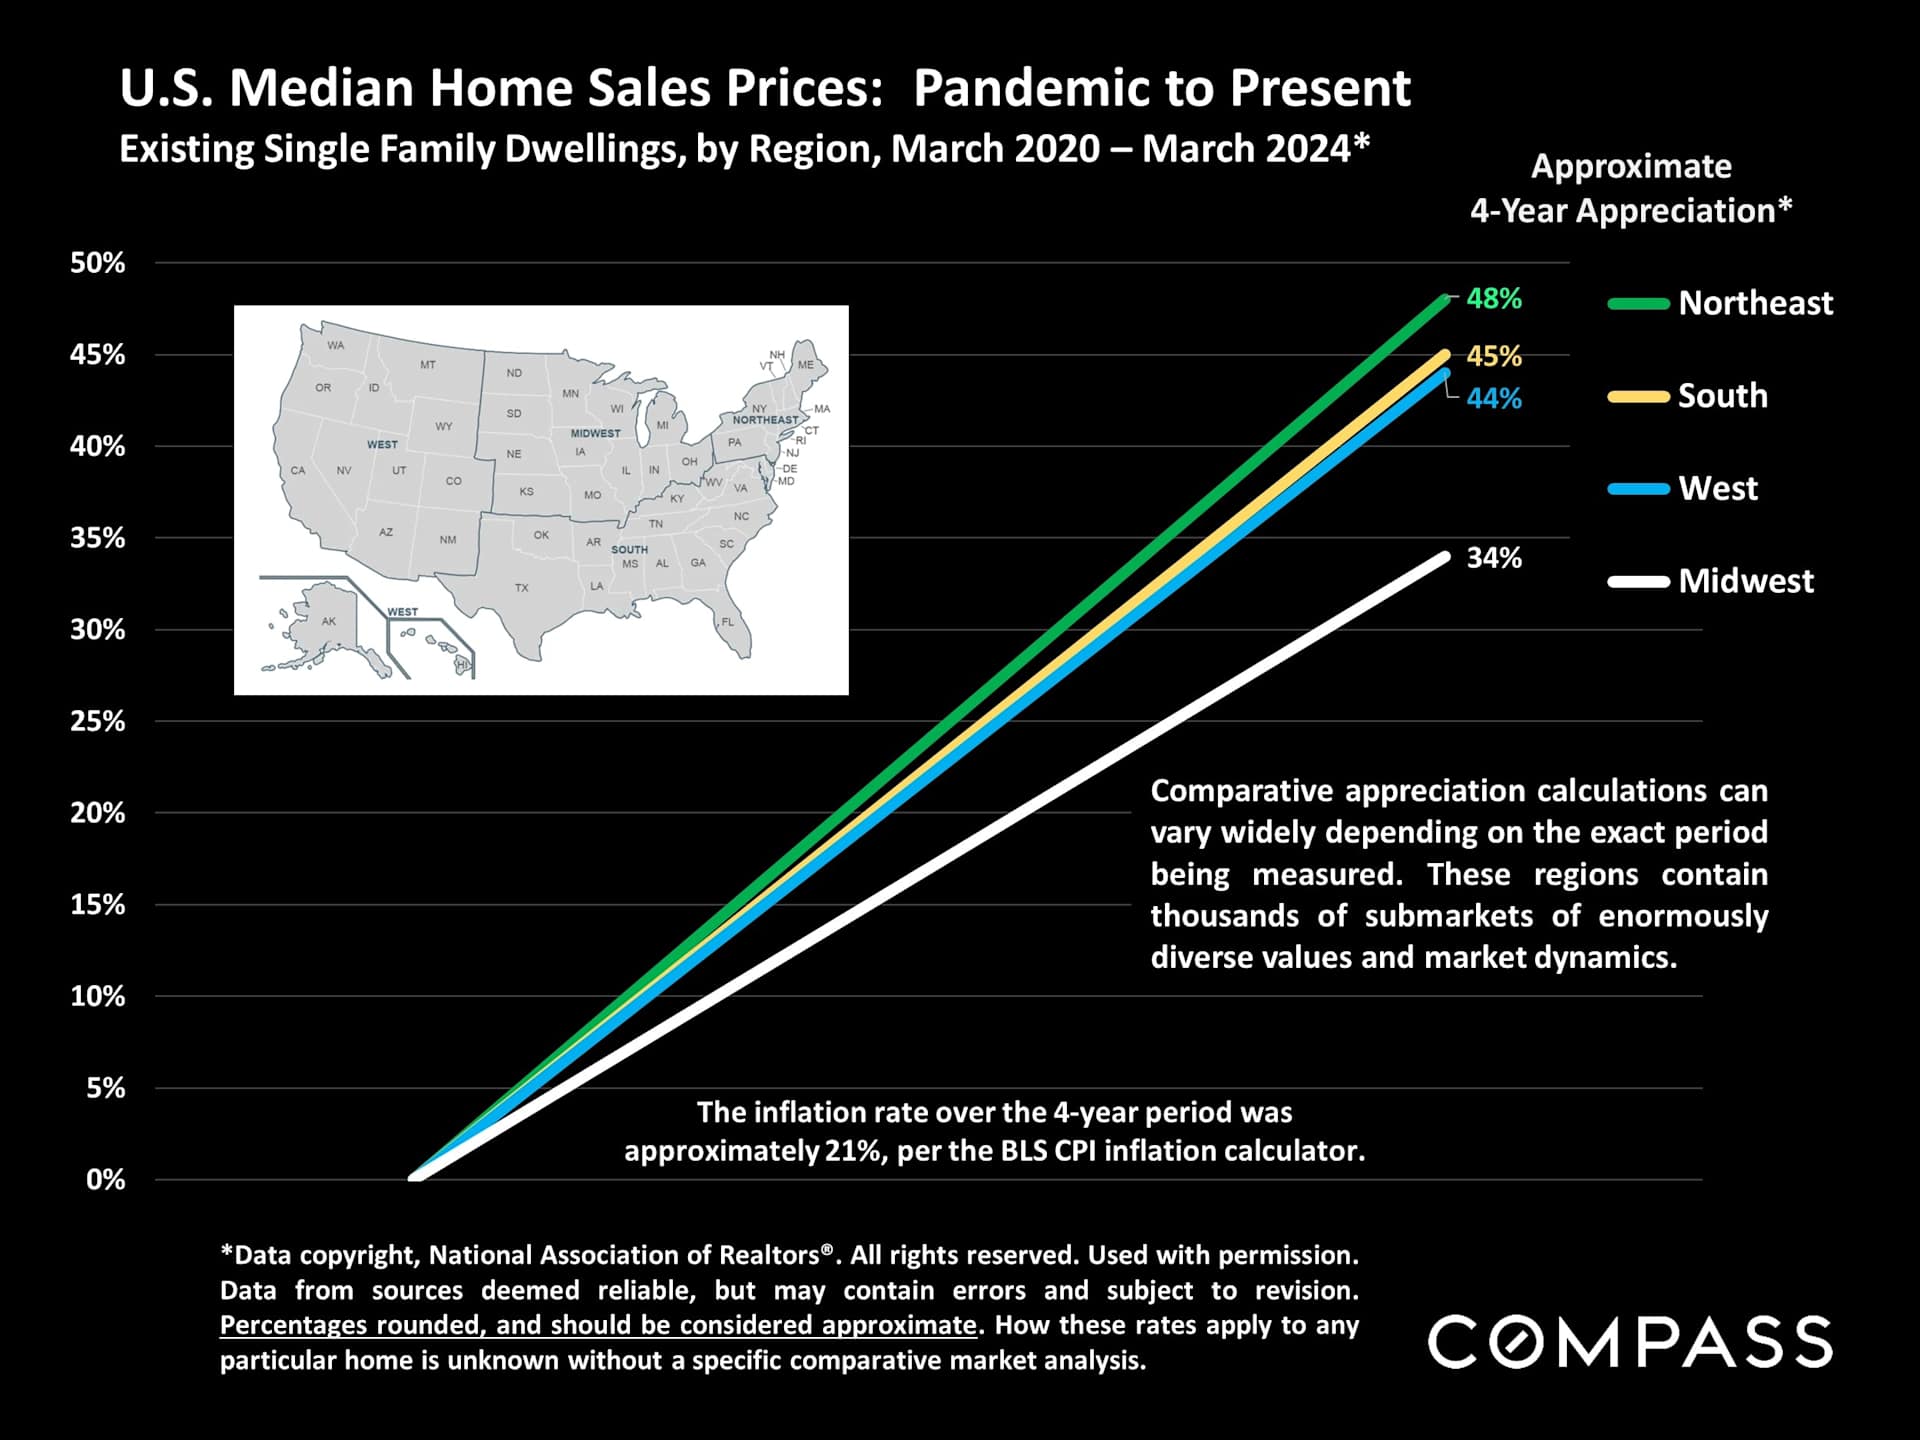
National regions have all seen dramatic appreciation rates over the past 4 years, running far above the CPI inflation rate during the period.
A breakdown of U.S. home sales by price segment: Sales in higher price ranges have been rising, while lower price segments have seen considerable declines. Part of this dynamic is simple home-price appreciation, but affluent buyers also appear to be playing a larger role in the market.

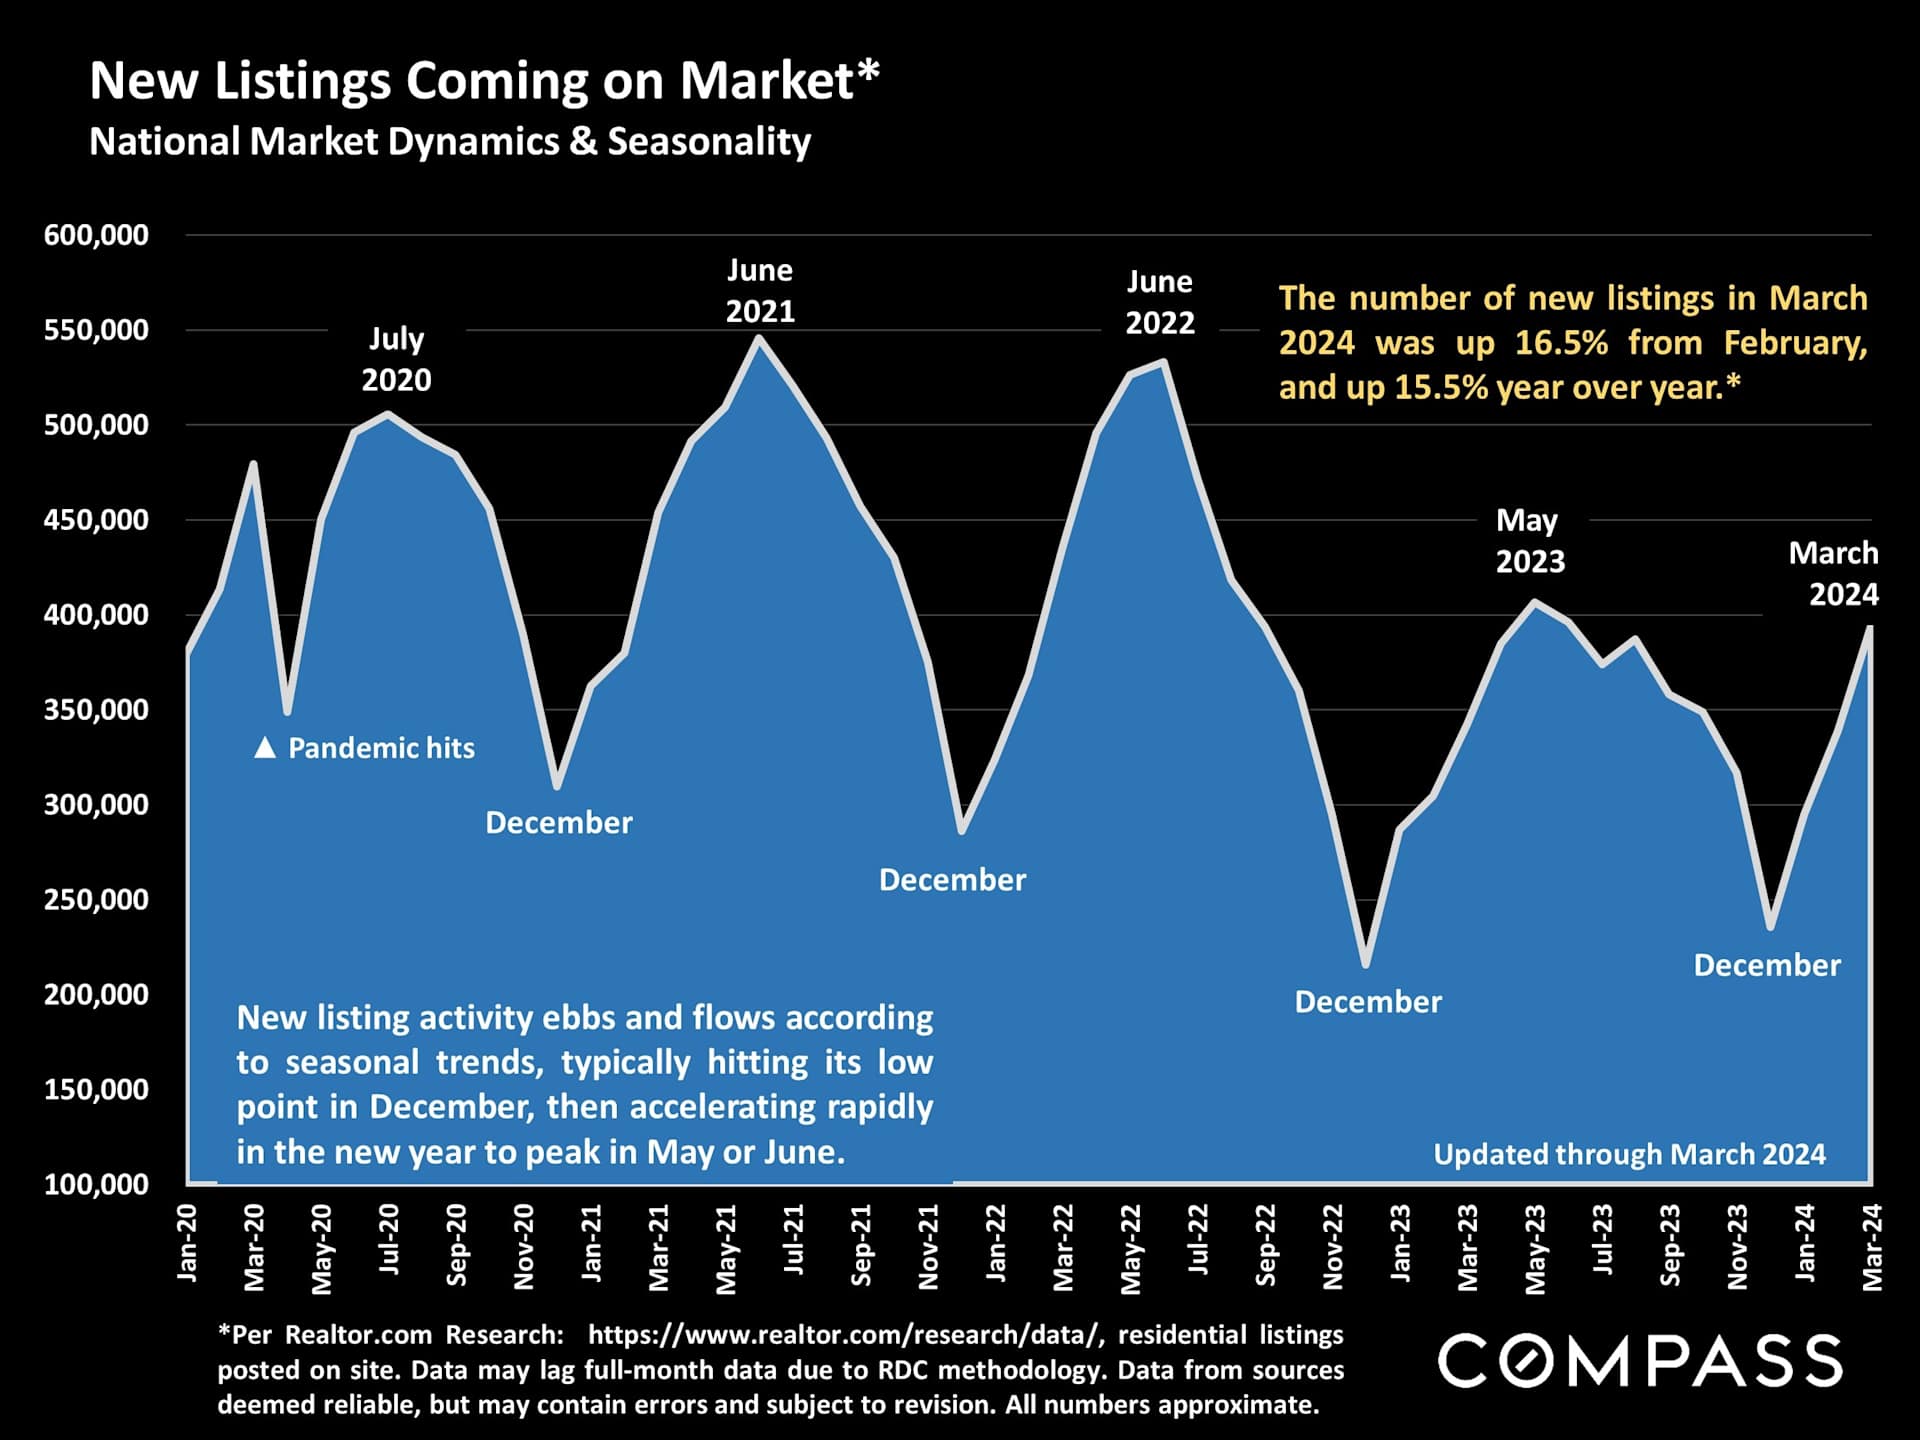
New listings are the life blood of the market and, happily, the number has been climbing rapidly. Though still considerably below long-term norms, 2024 will probably see a substantial increase in inventory over last year.
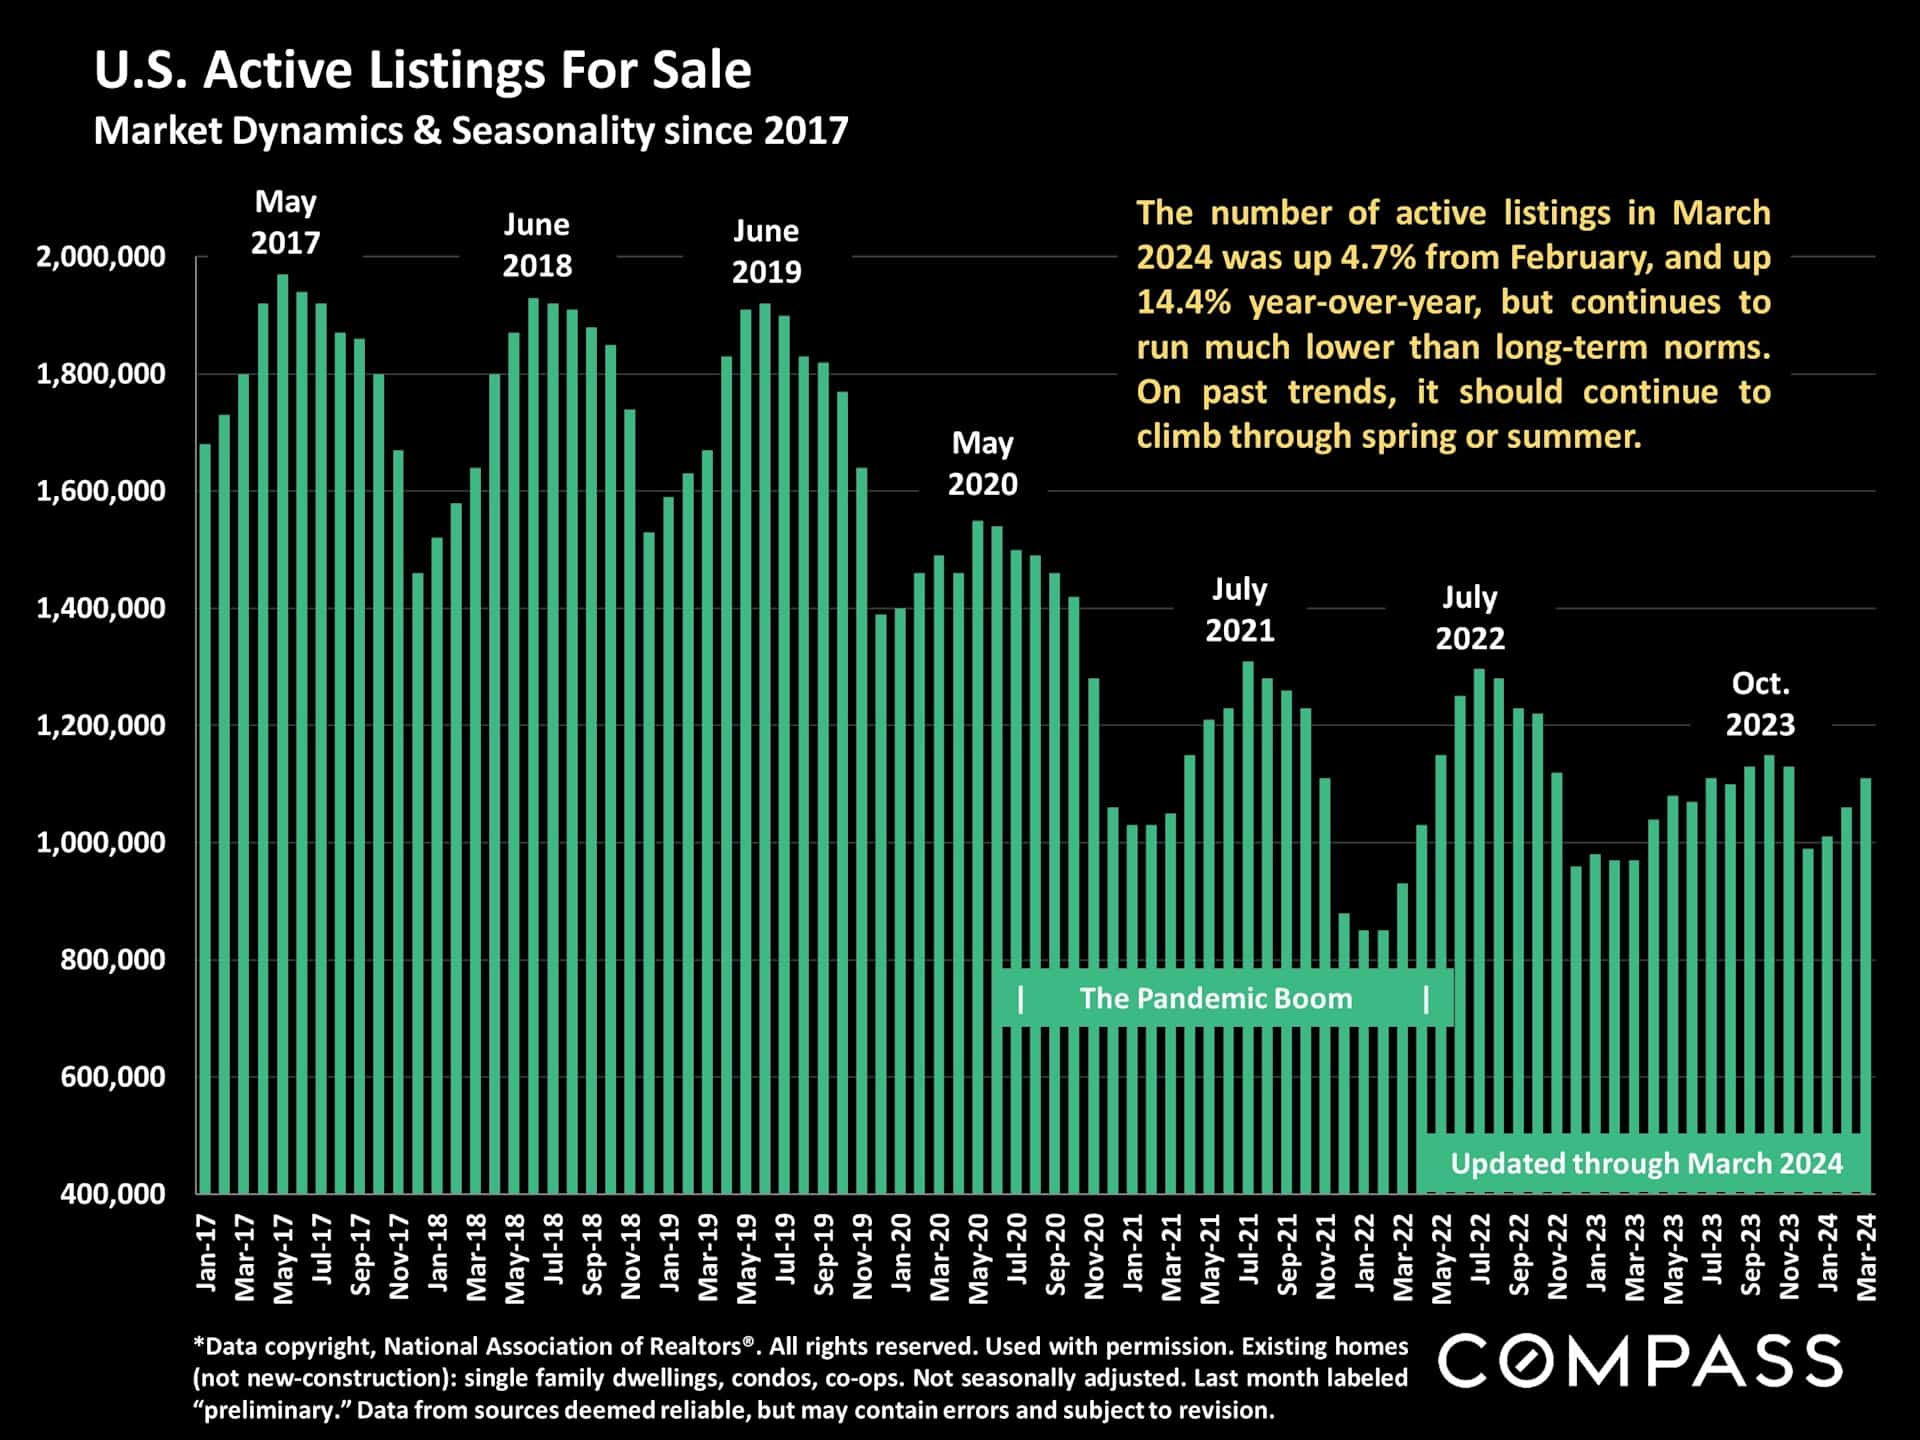
This next chart illustrates how far down the inventory of active listings is from pre-pandemic levels. However, it is running significantly higher year-over-year. The number of active listings is affected by how many new listings come on market, how quickly buyers snap them up, and the sustained market heat over time.
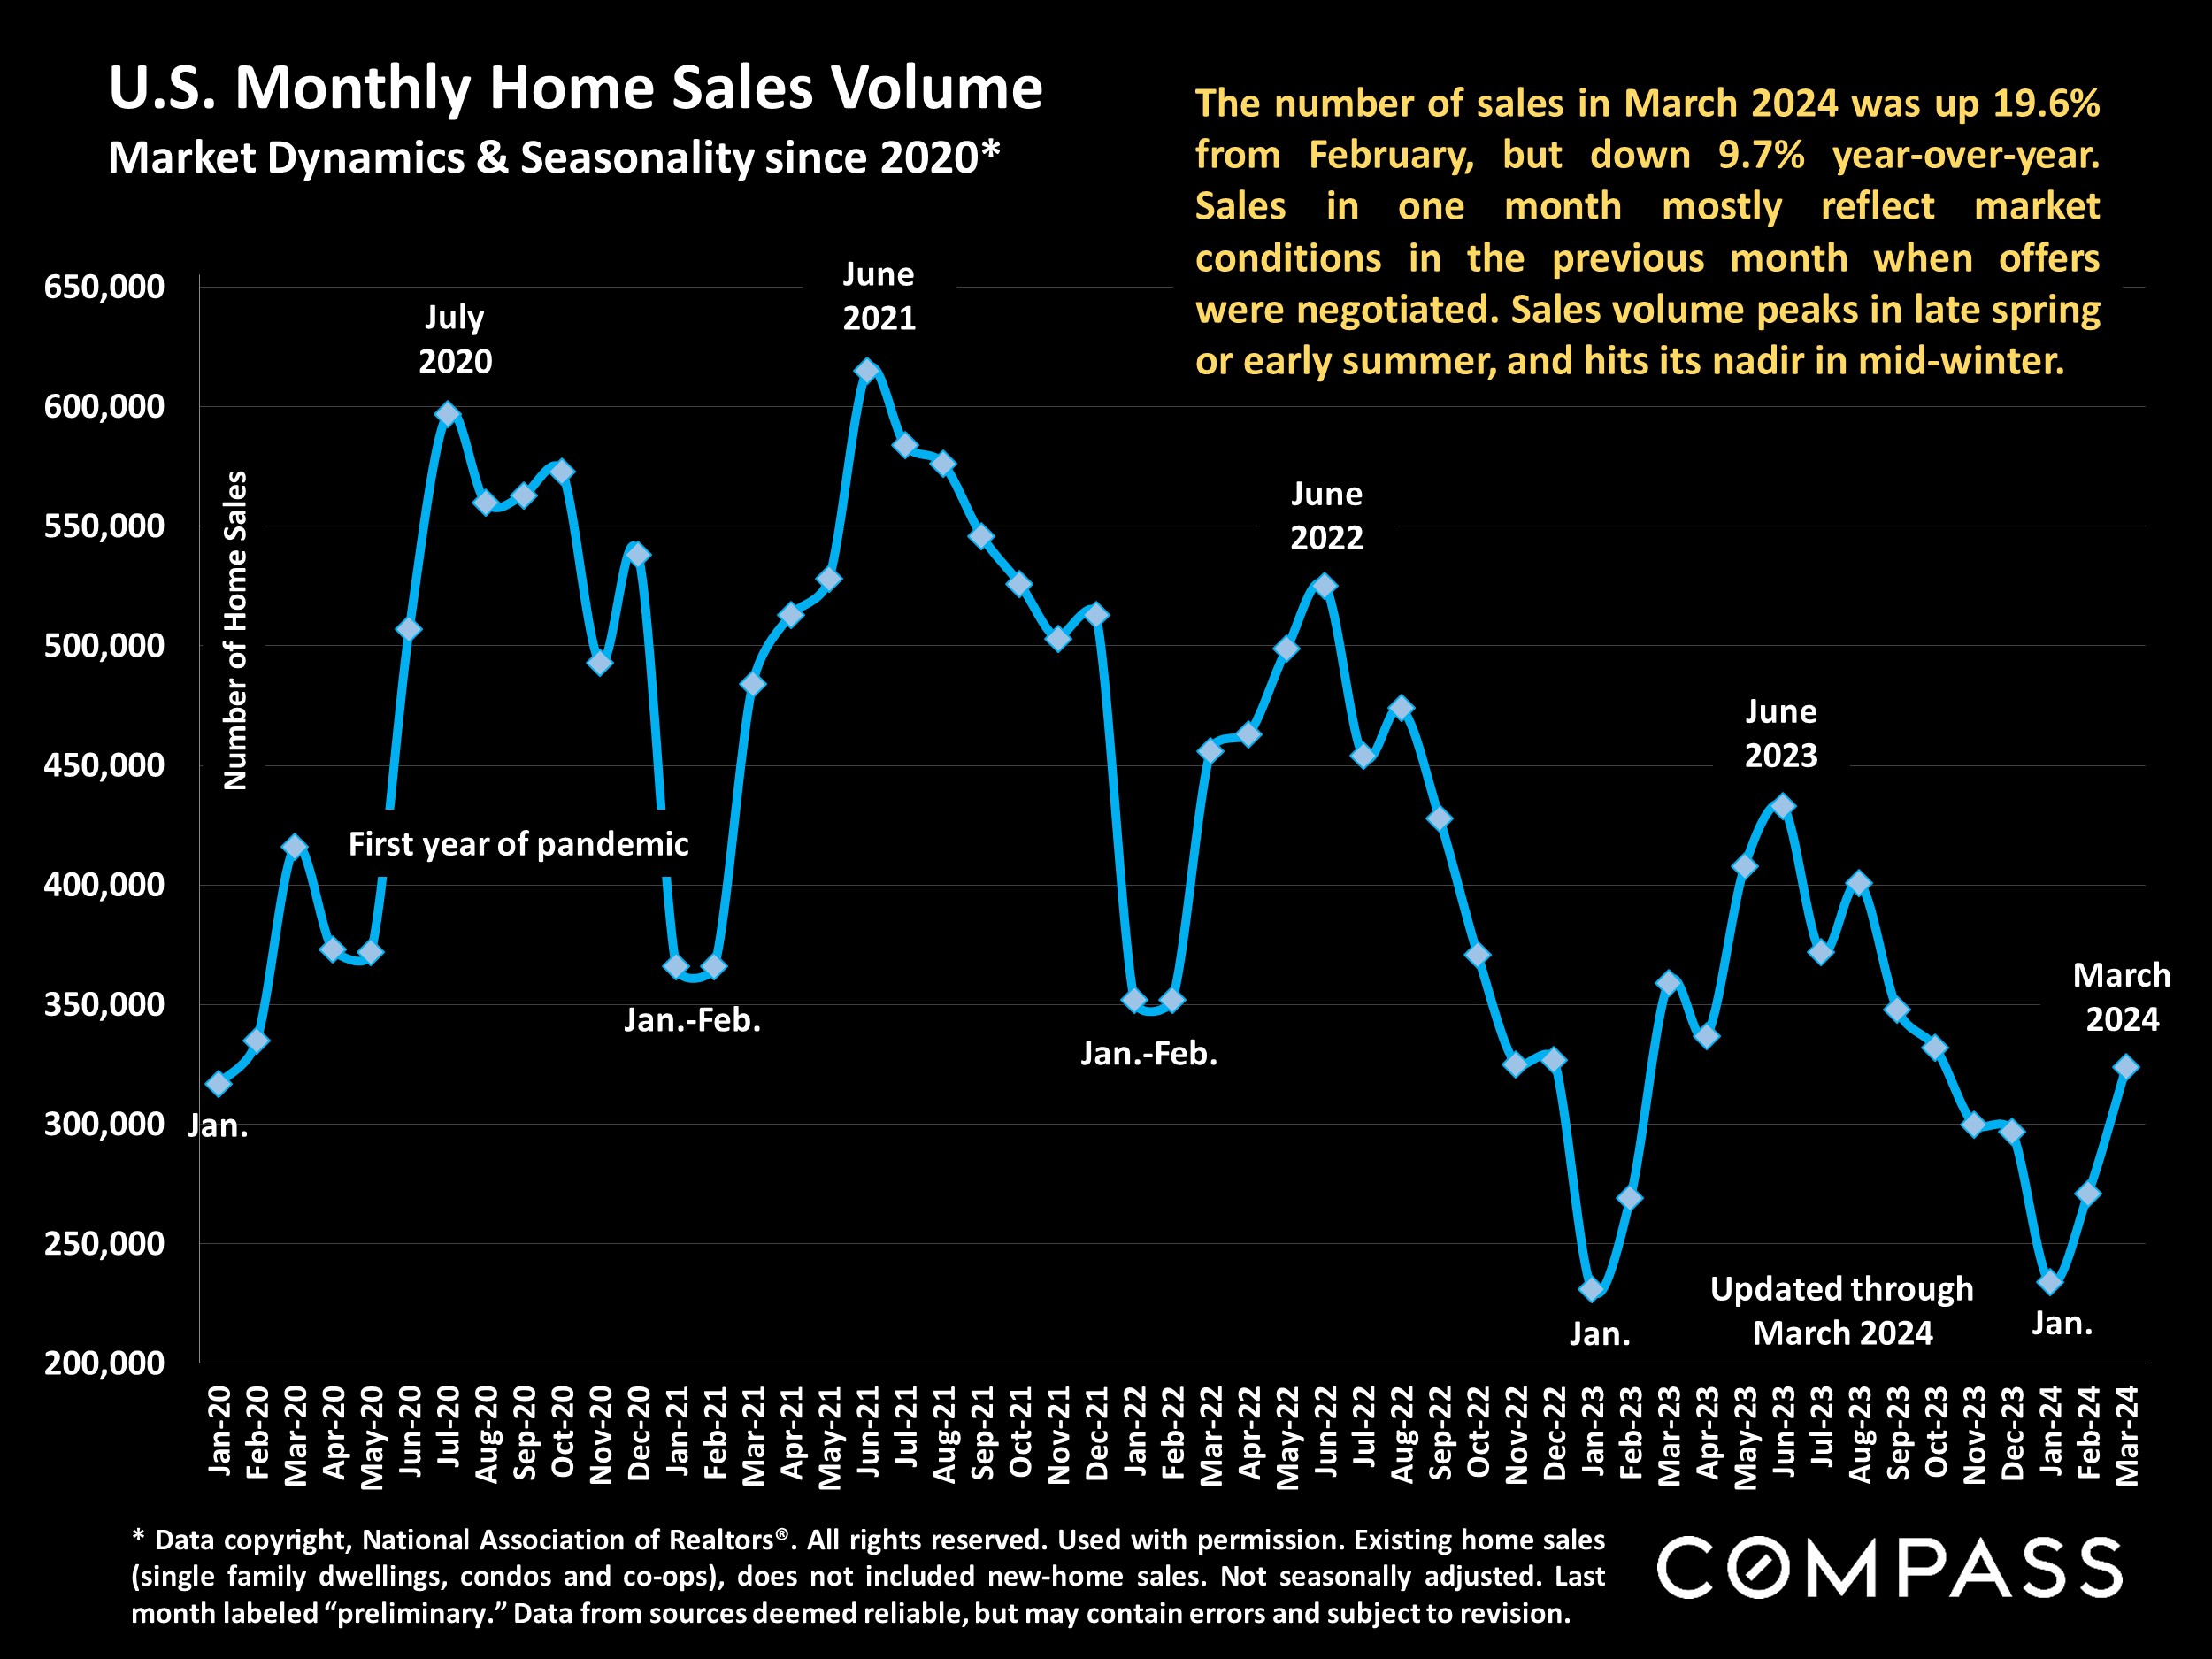
Sales are a lagging indicator, running 3 to 6+ weeks behind new listings coming on market and listings going into contract. Based on the surge in inventory in March, we expect sales volume to jump substantially in April.
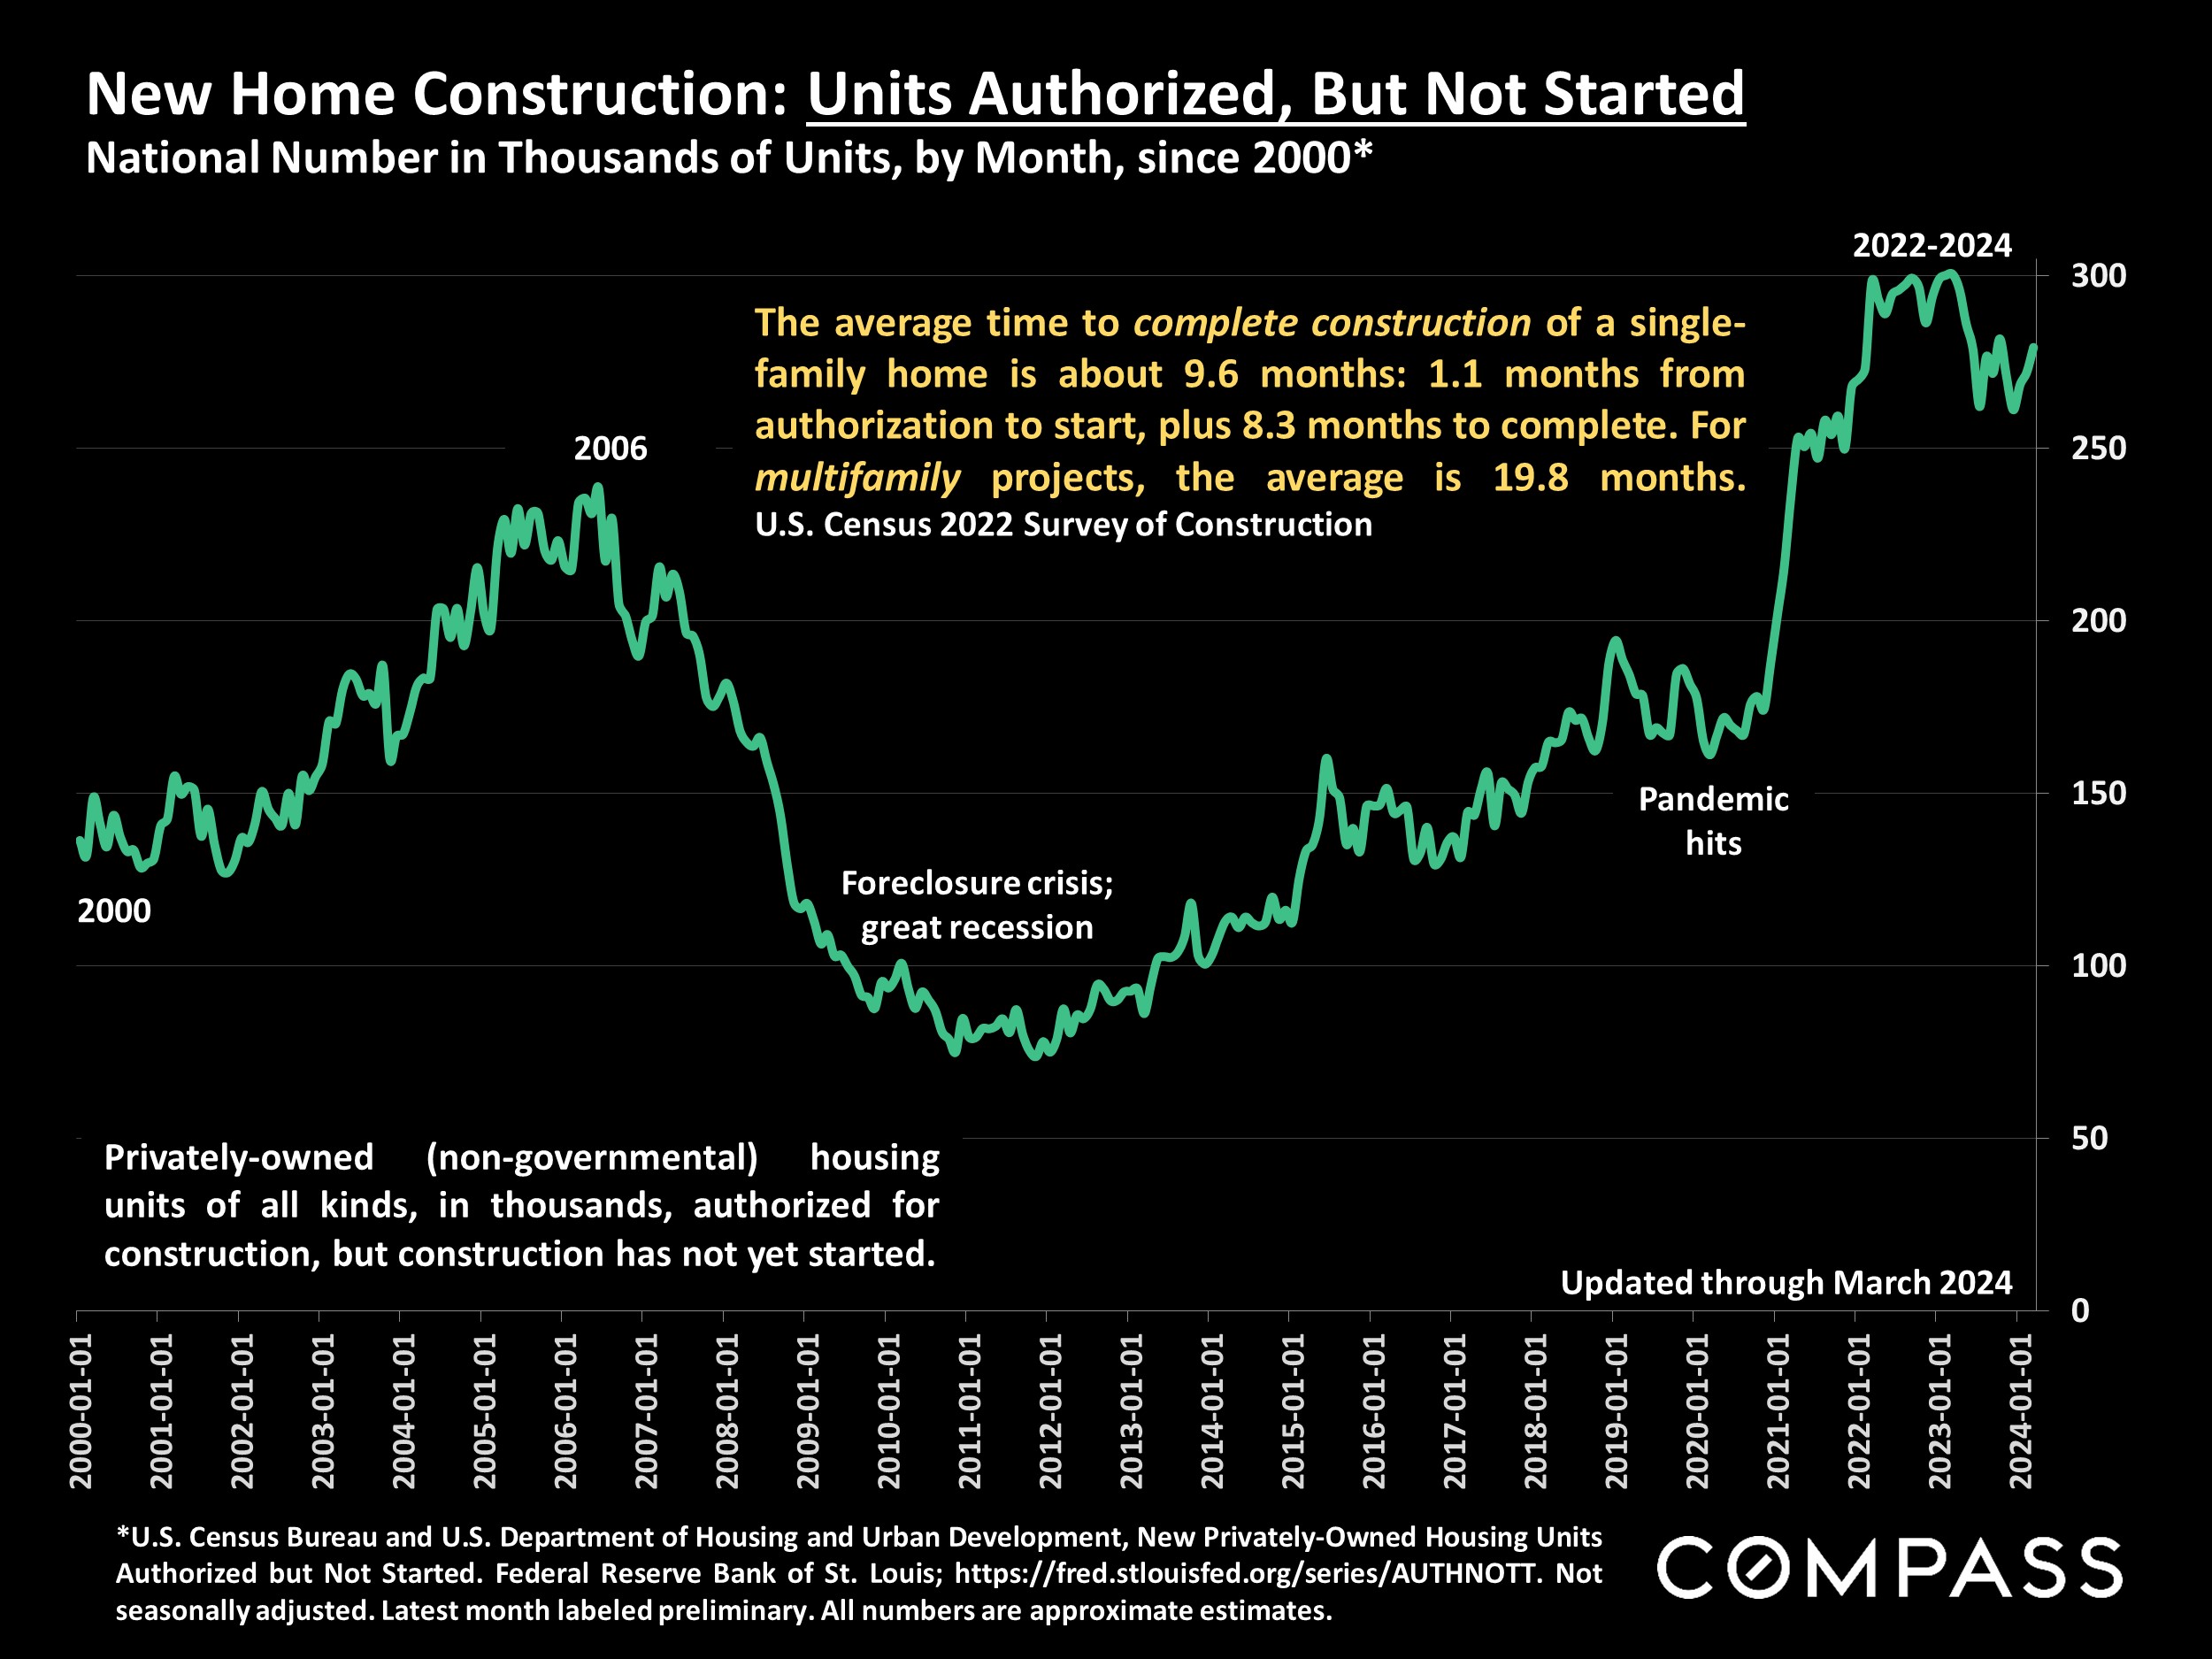
The number of housing units authorized for construction is down from its recent peak, but running quite high by longer-term standards. Developers are eager to take advantage of buyer demand frustrated by low levels of resale inventory.
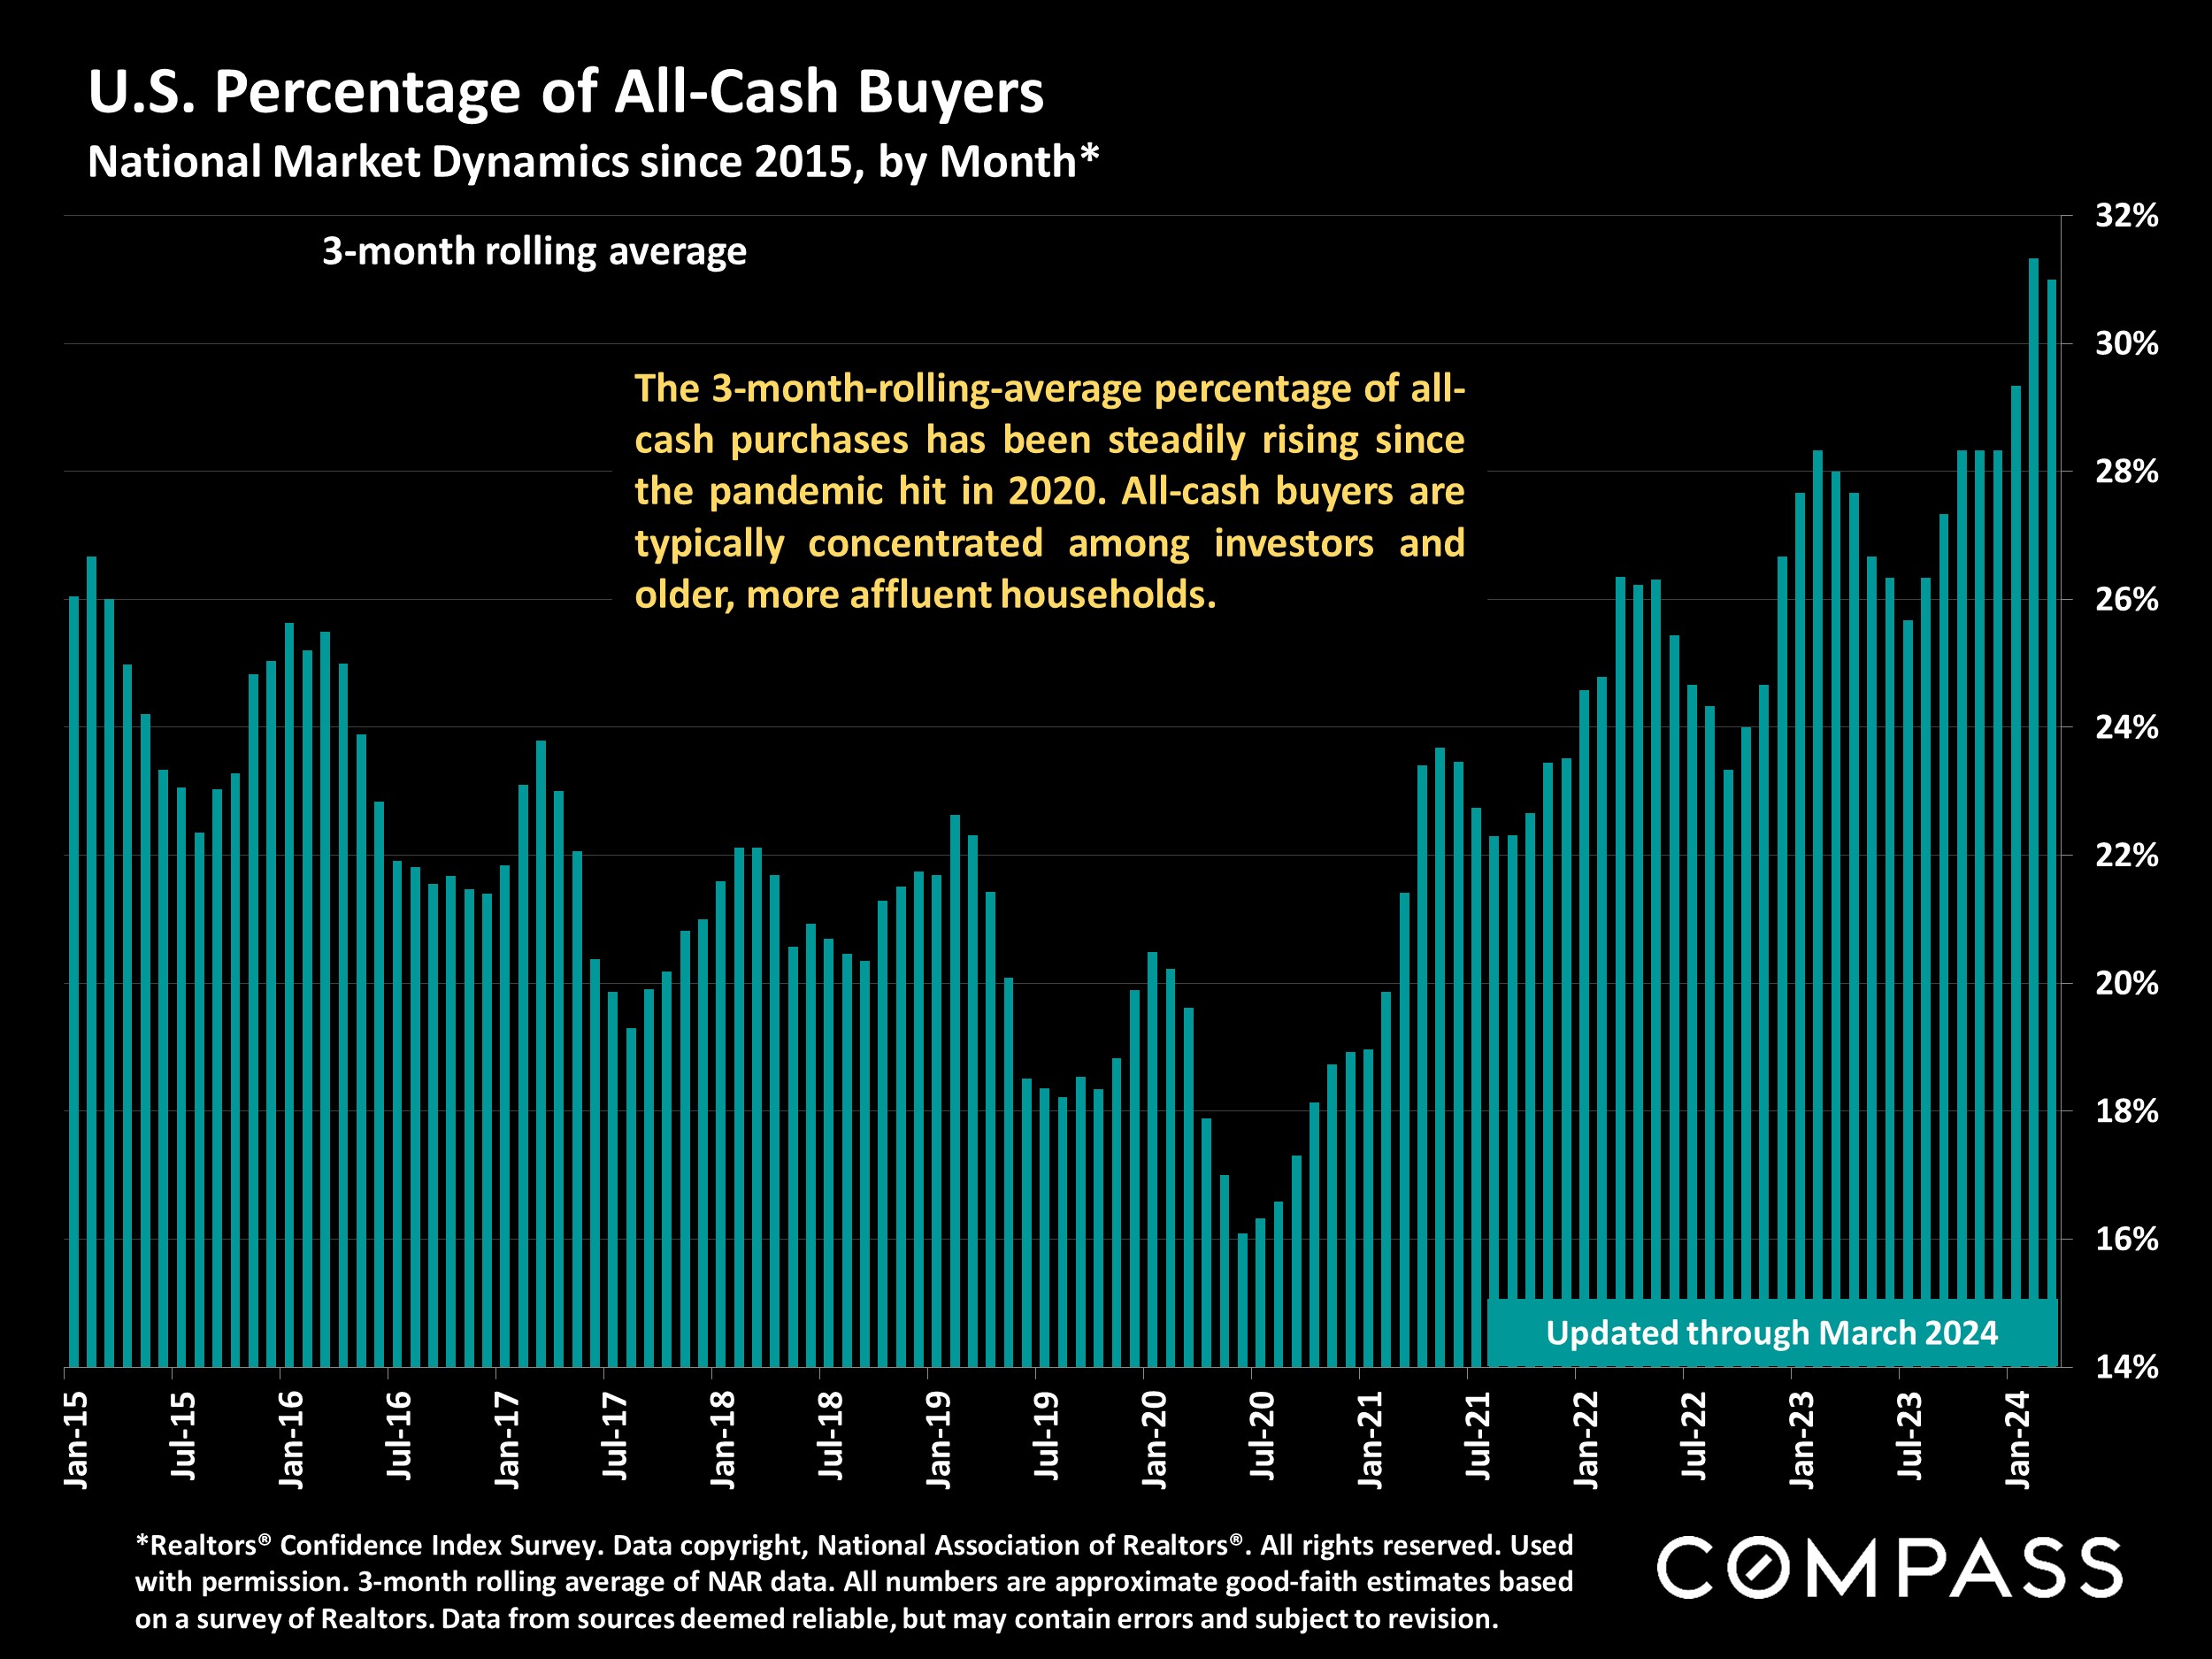
Generally speaking, all-cash buyers continue to play a larger role in the market.
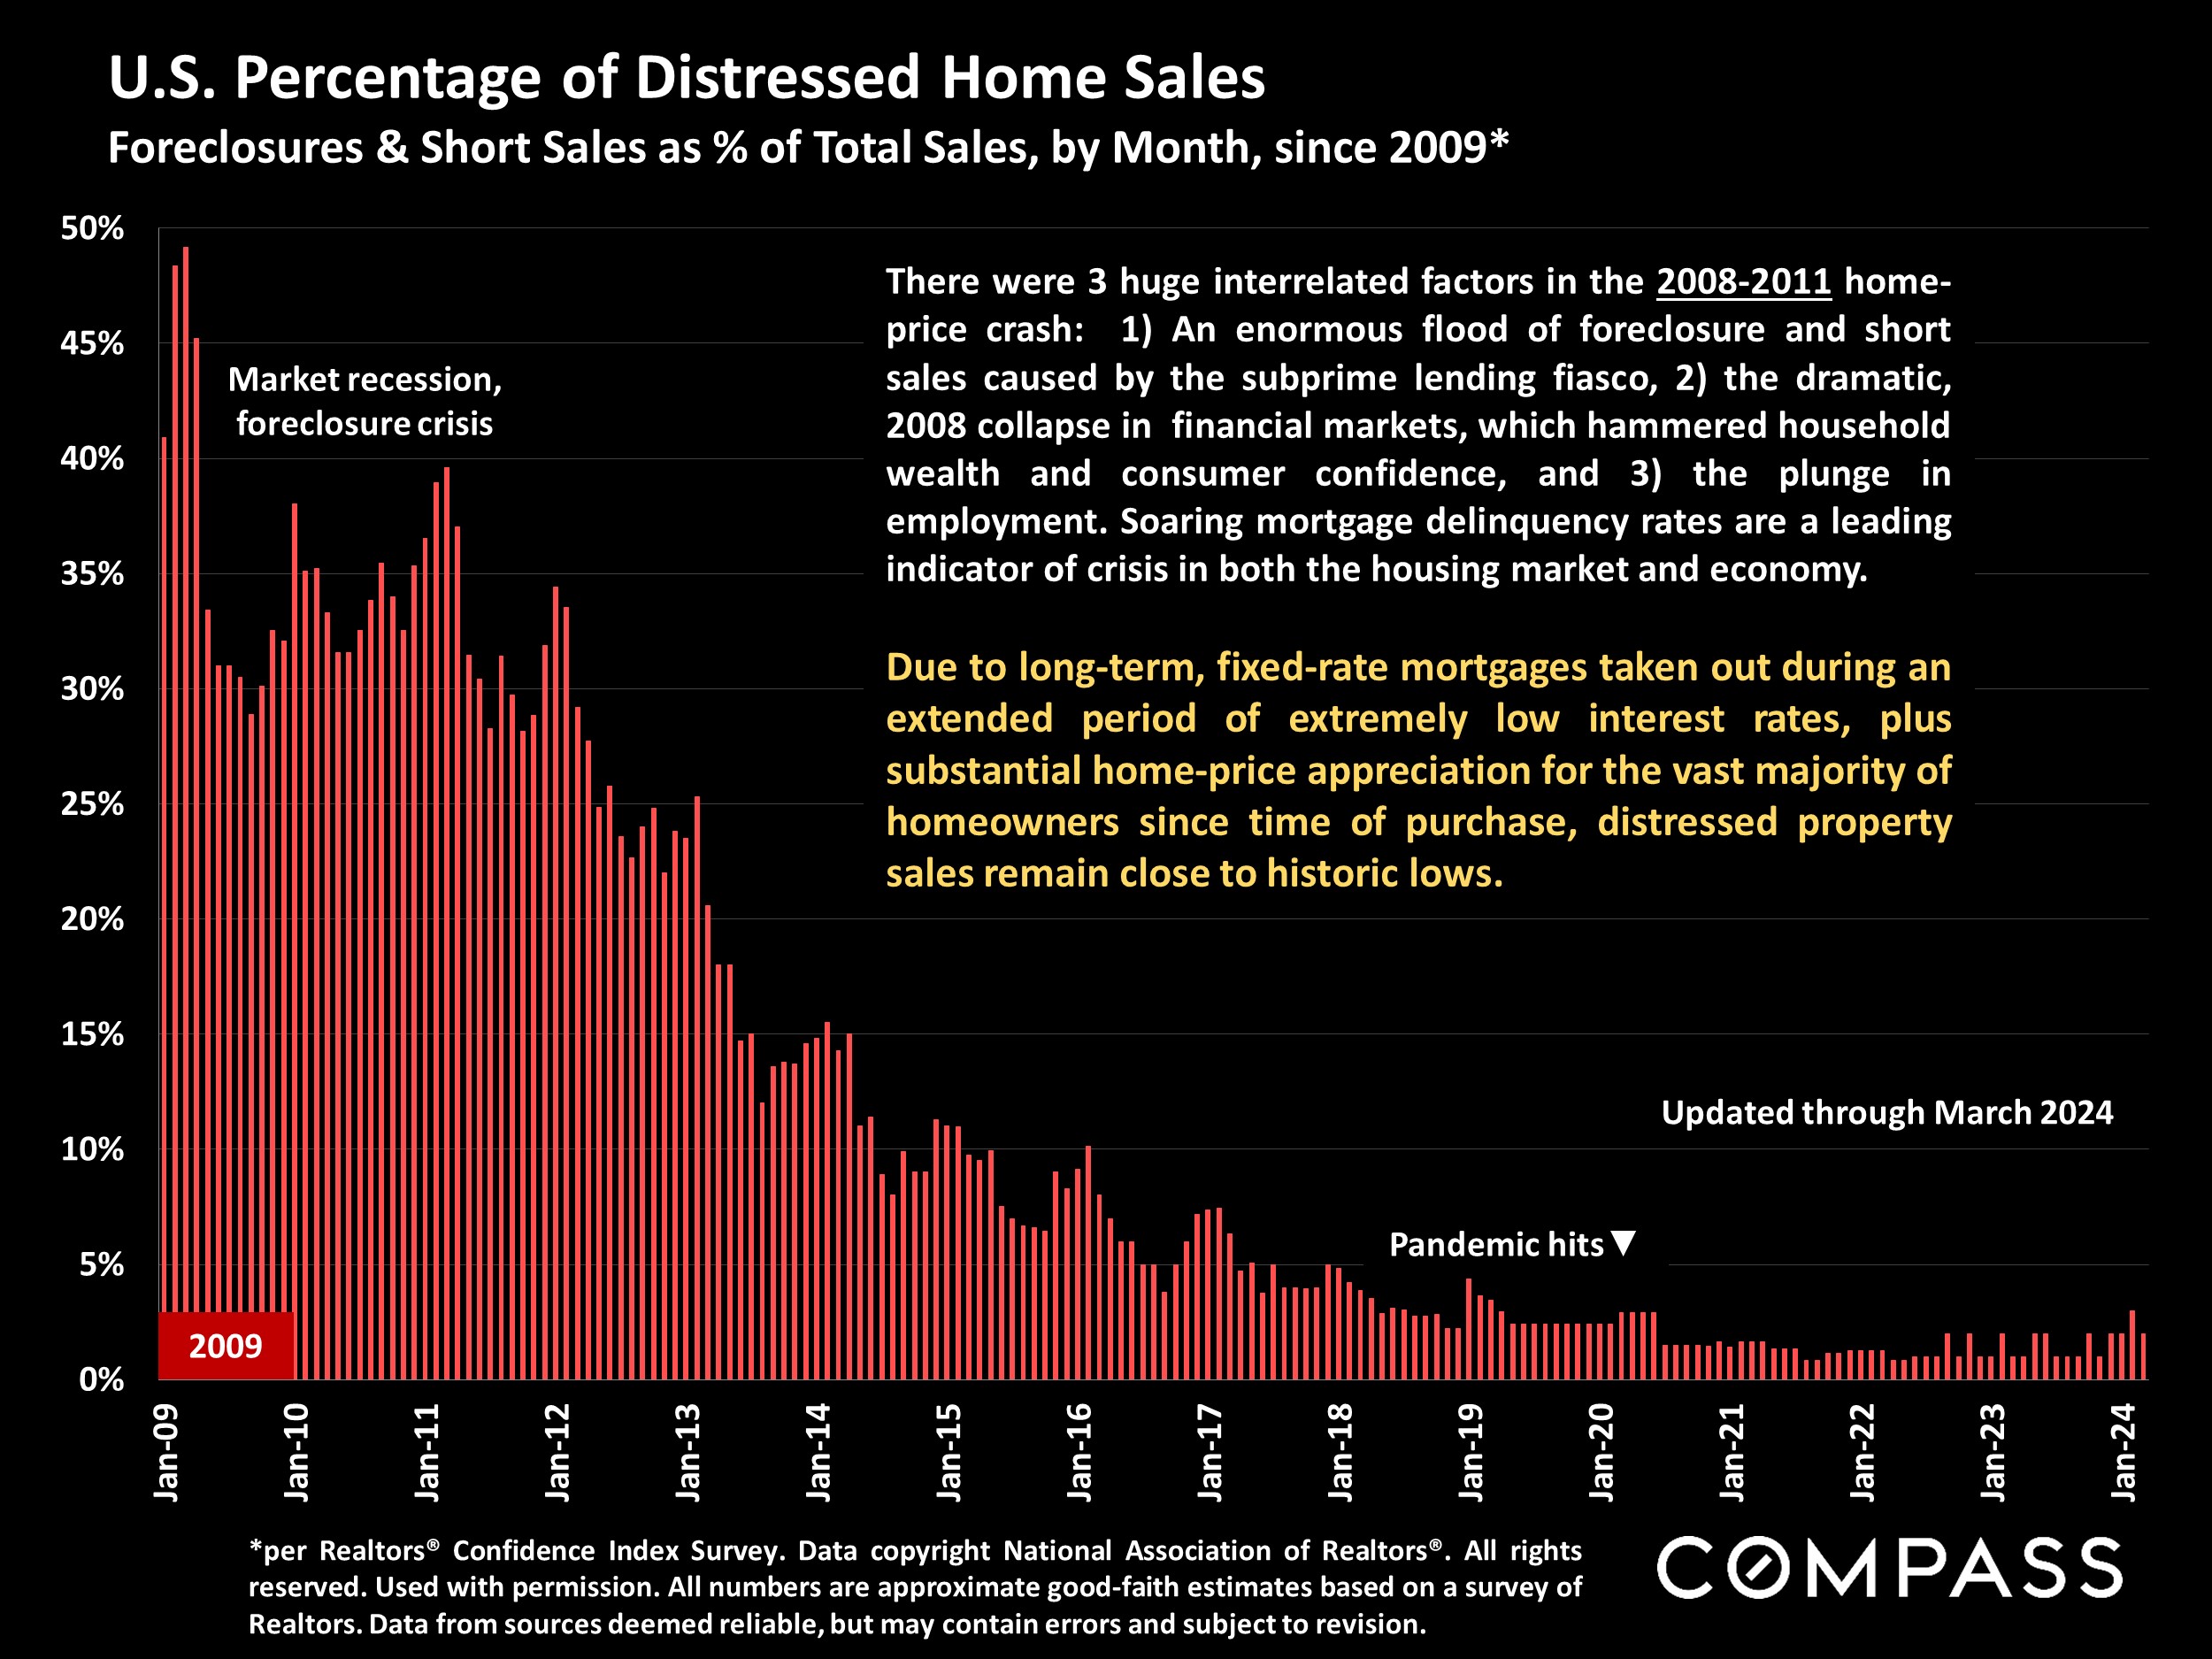
Between the low-interest rate mortgages so many homeowners have, plus dramatic home-price appreciation, the number of distressed-property sales - foreclosures & short sales - remains negligible.
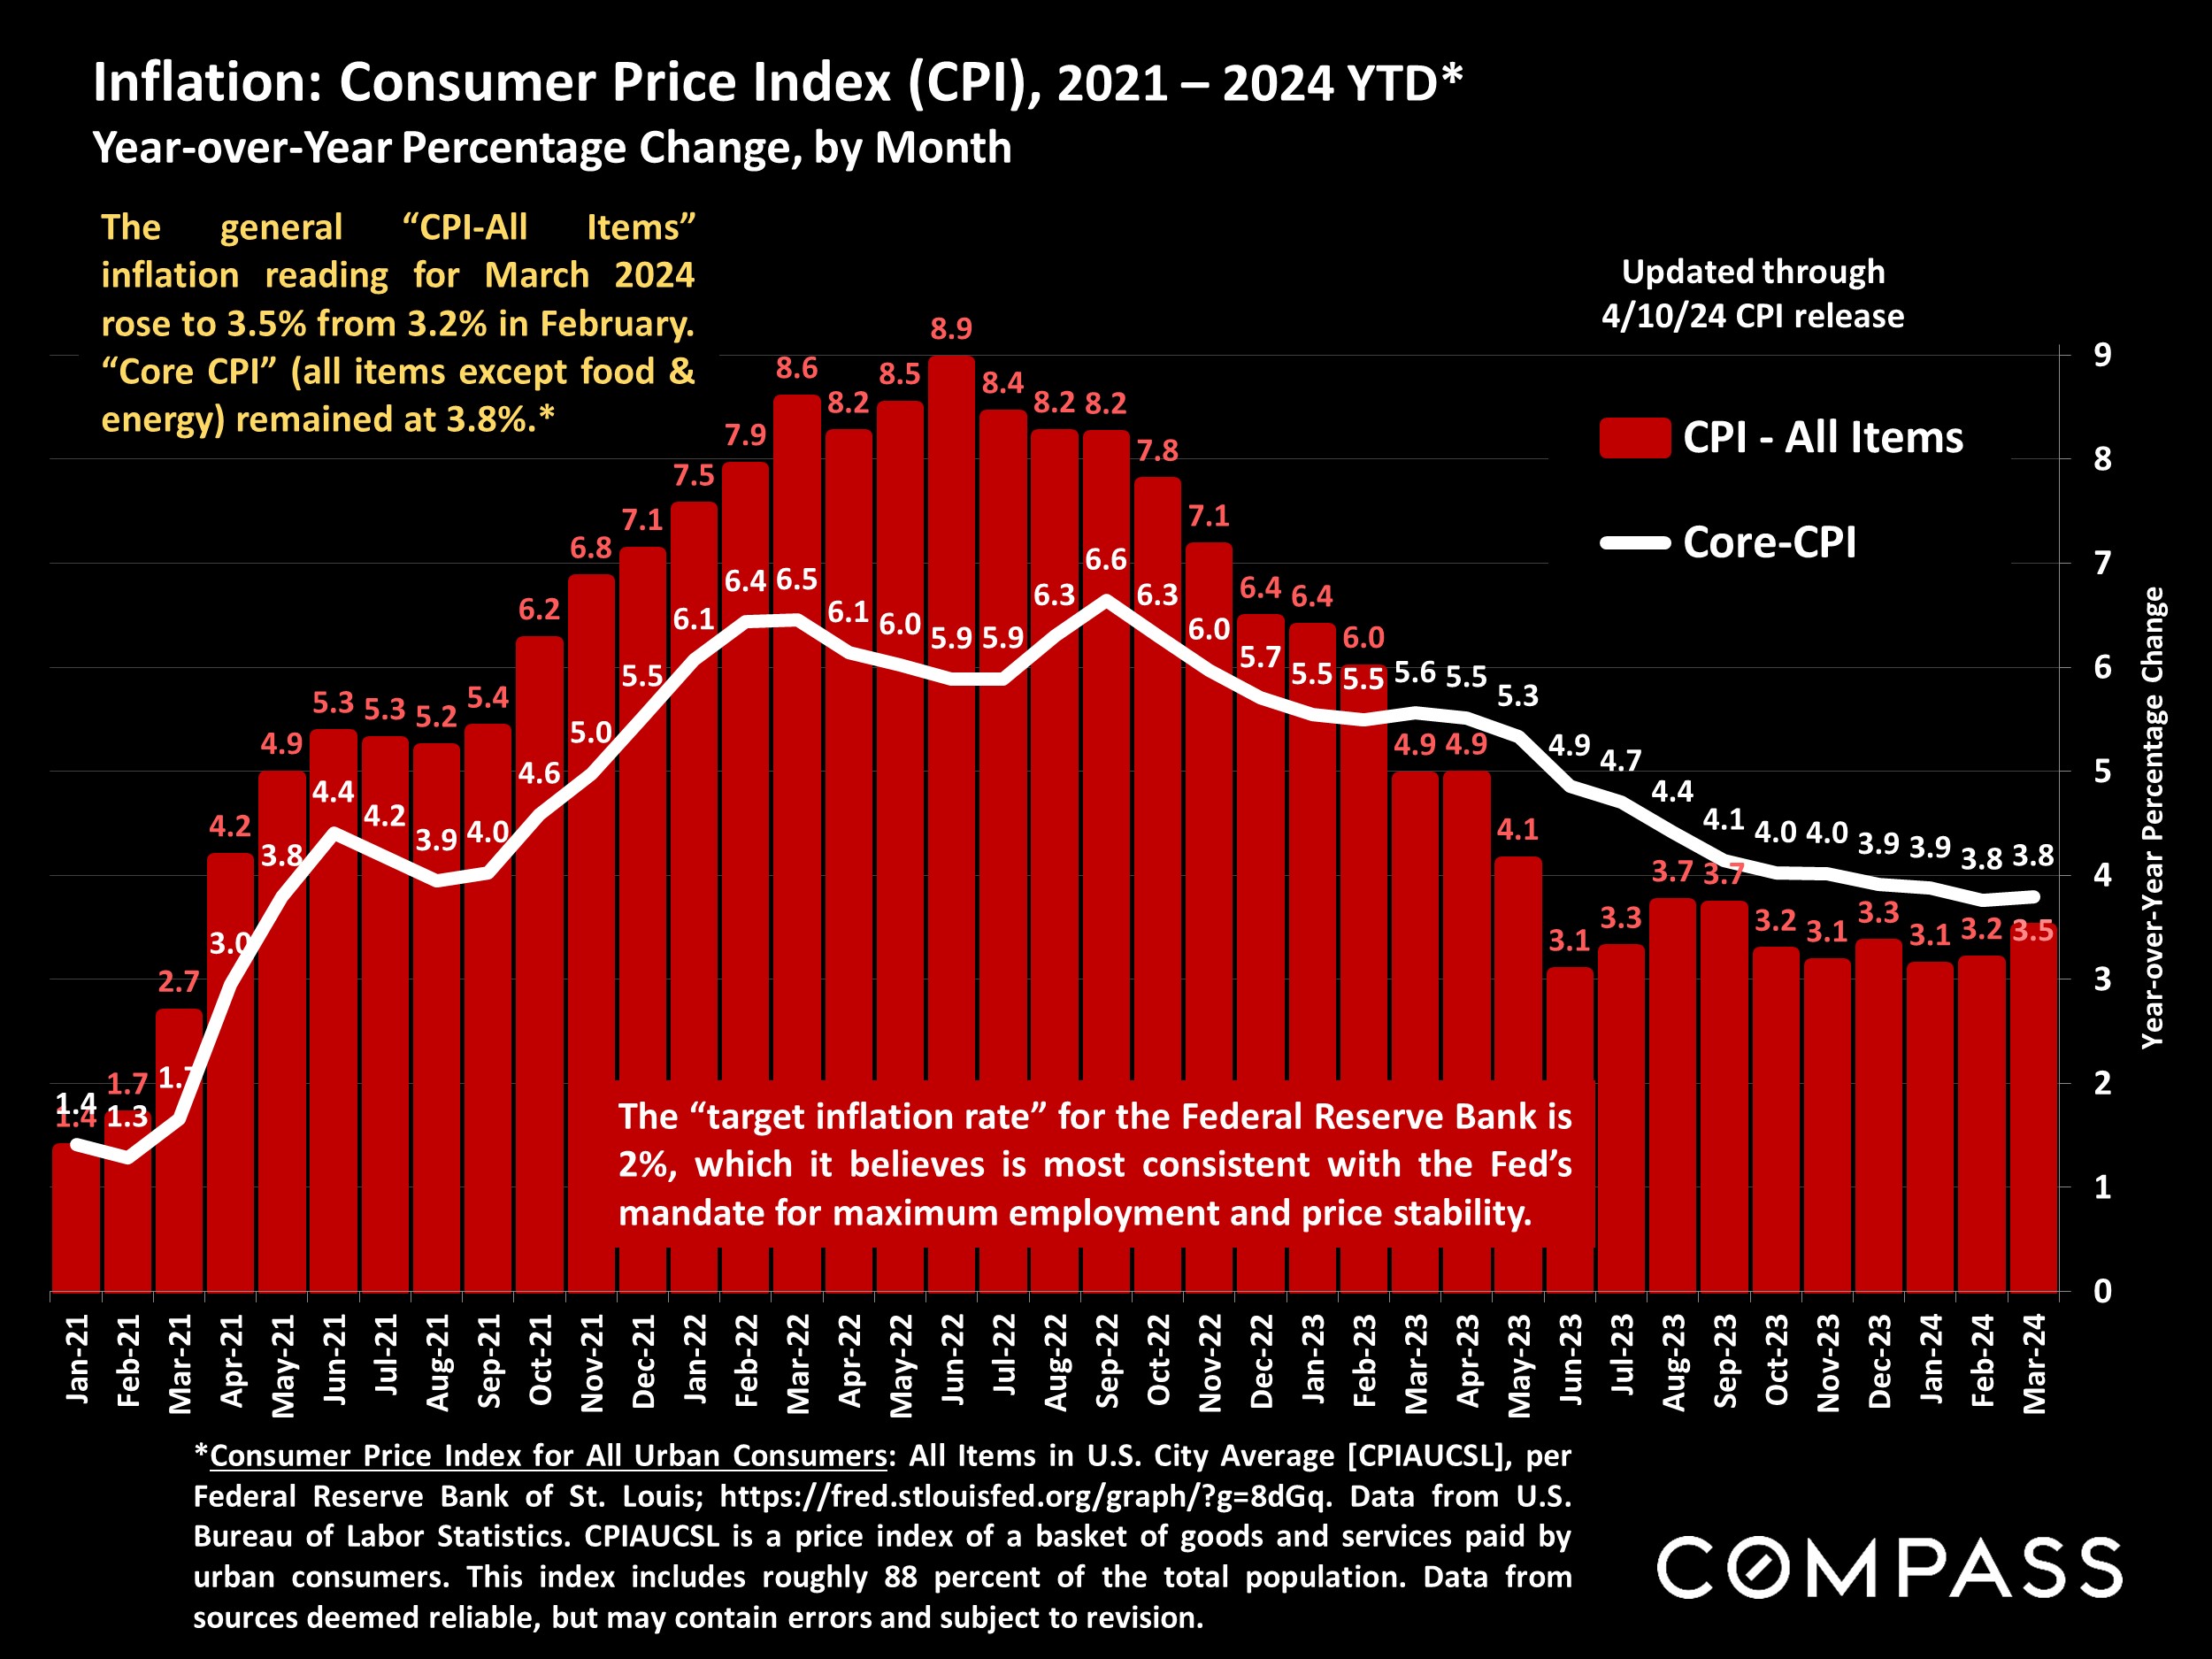
Inflation has plummeted since mid-2022, but proven resistant to decline over the past 10 months. The March readings disappointed investors, and upended expectations for the Fed to lower rates, in multiple steps, in 2024. Still, inflation may drop in coming months, and quickly change the picture again.
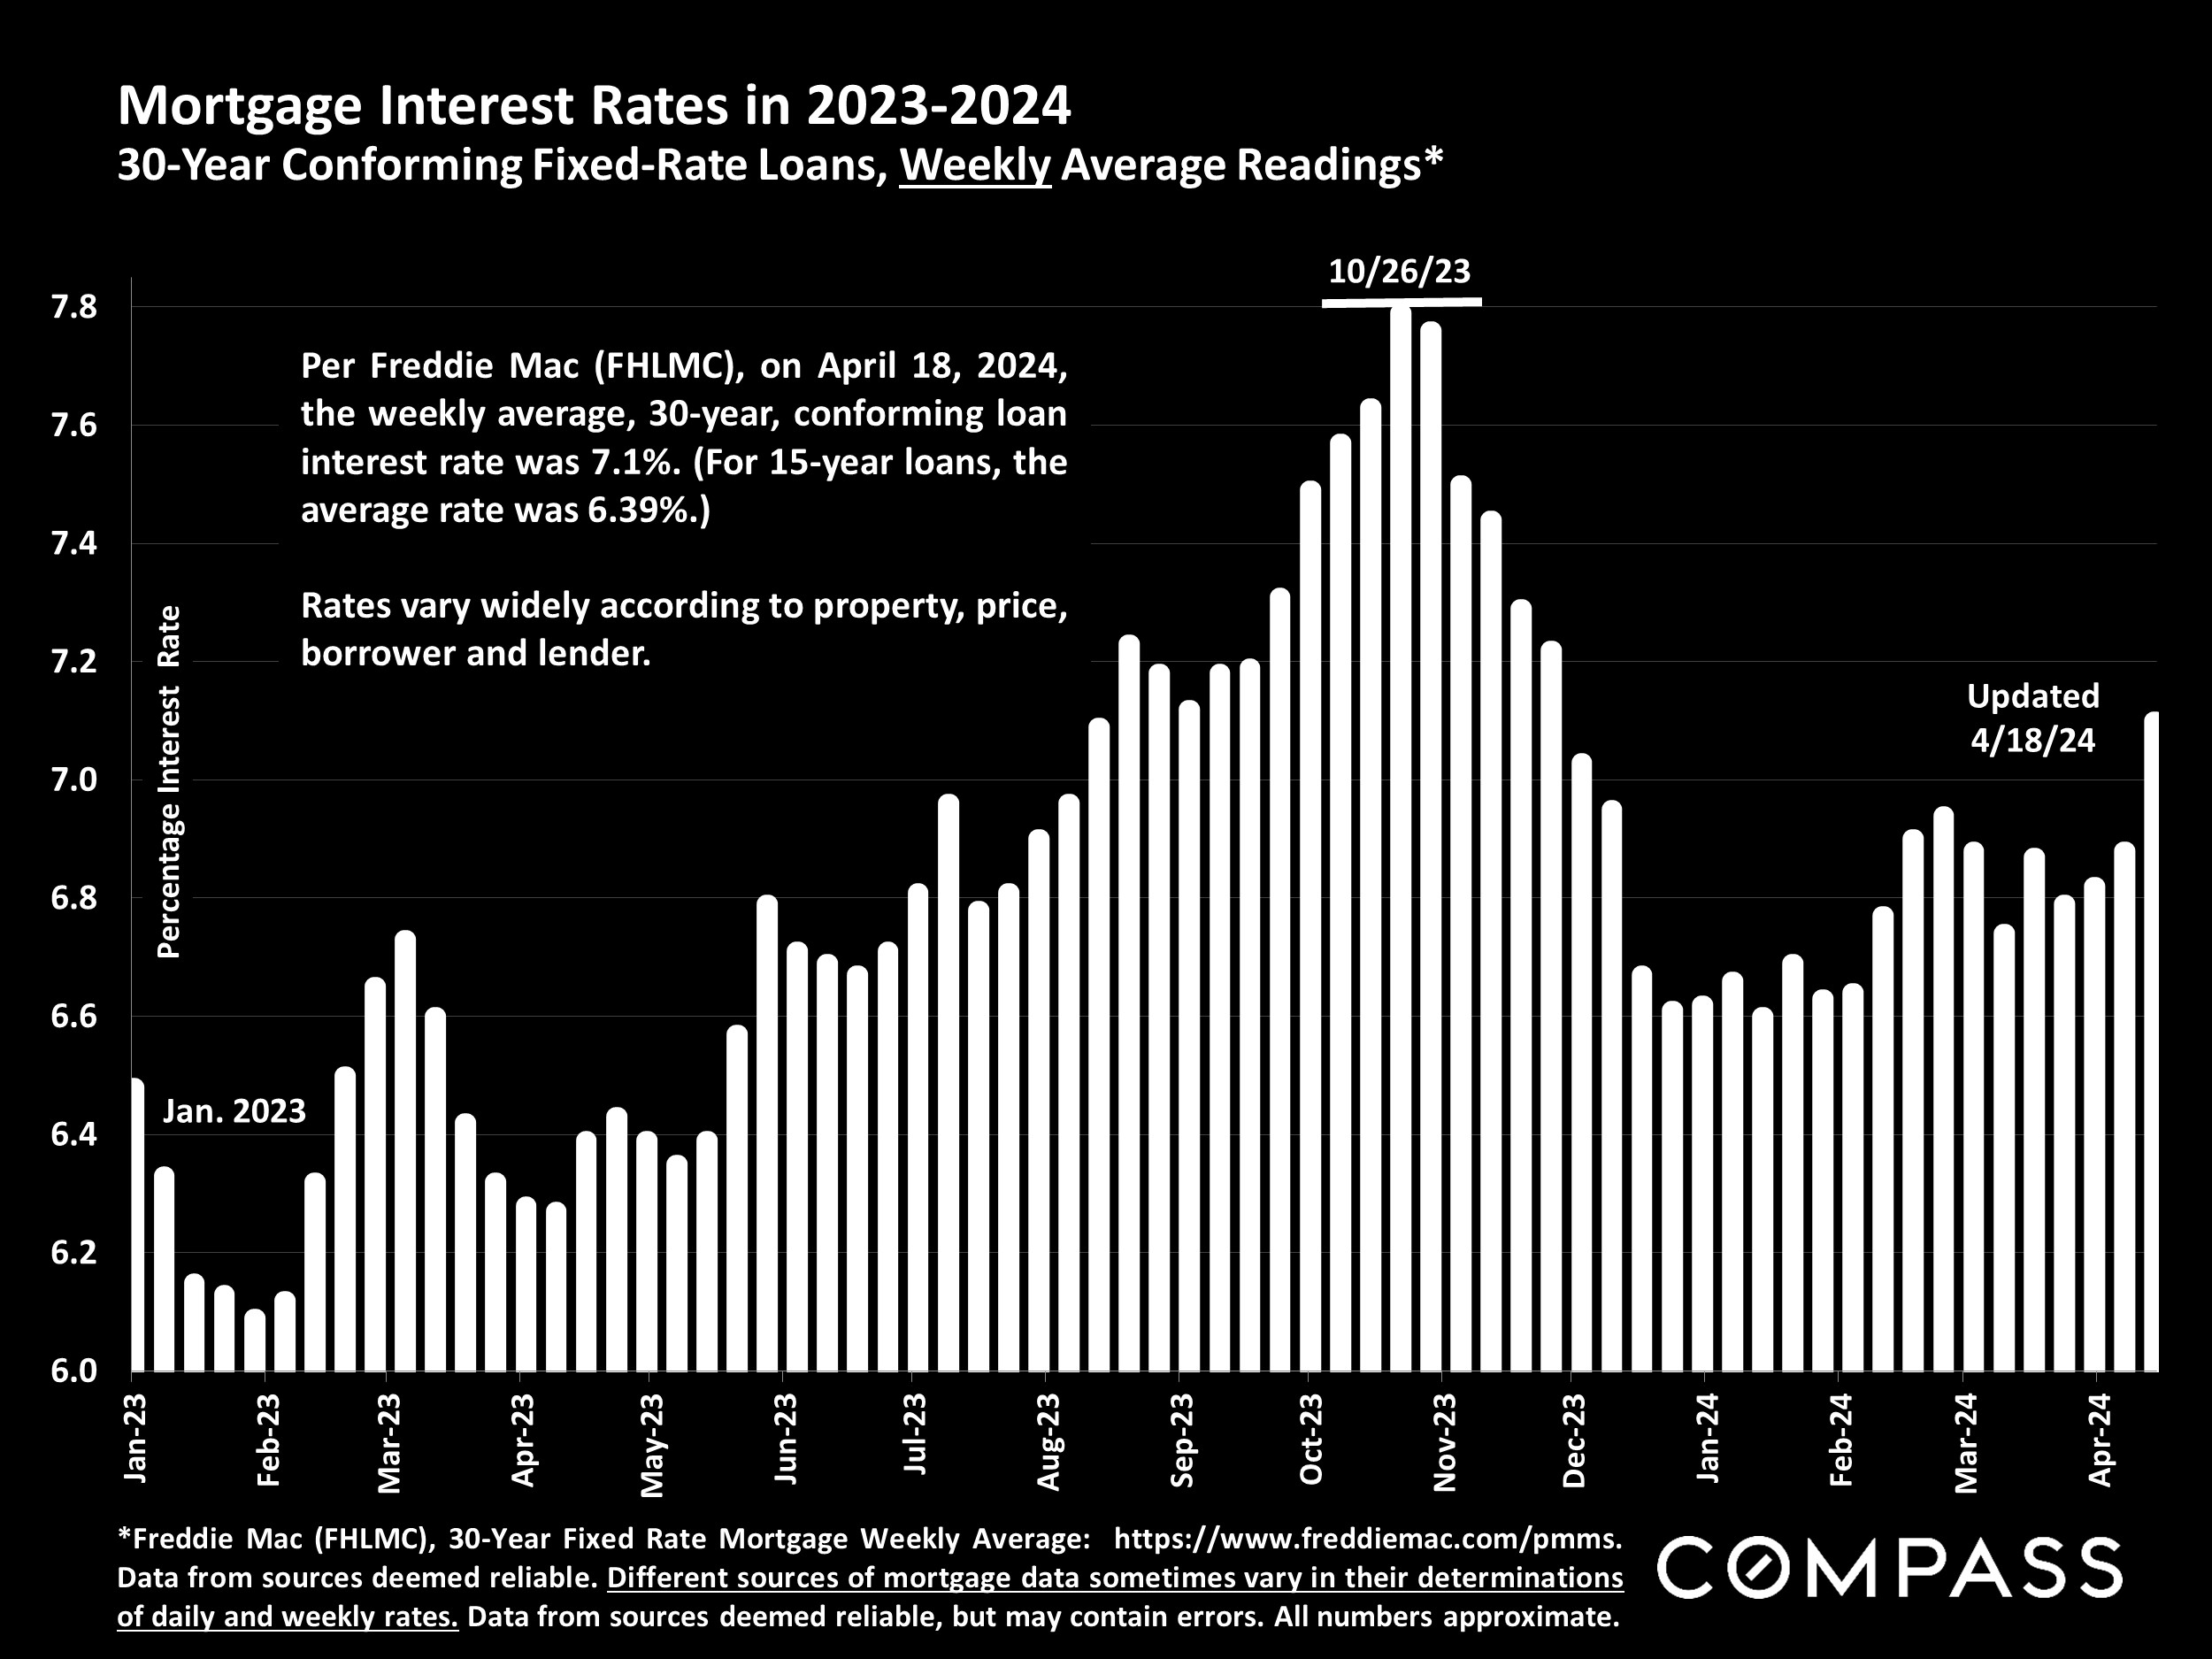
The March inflation readings, released April 10th, caused mortgage interest rates to surpass 7% for the first time this year.
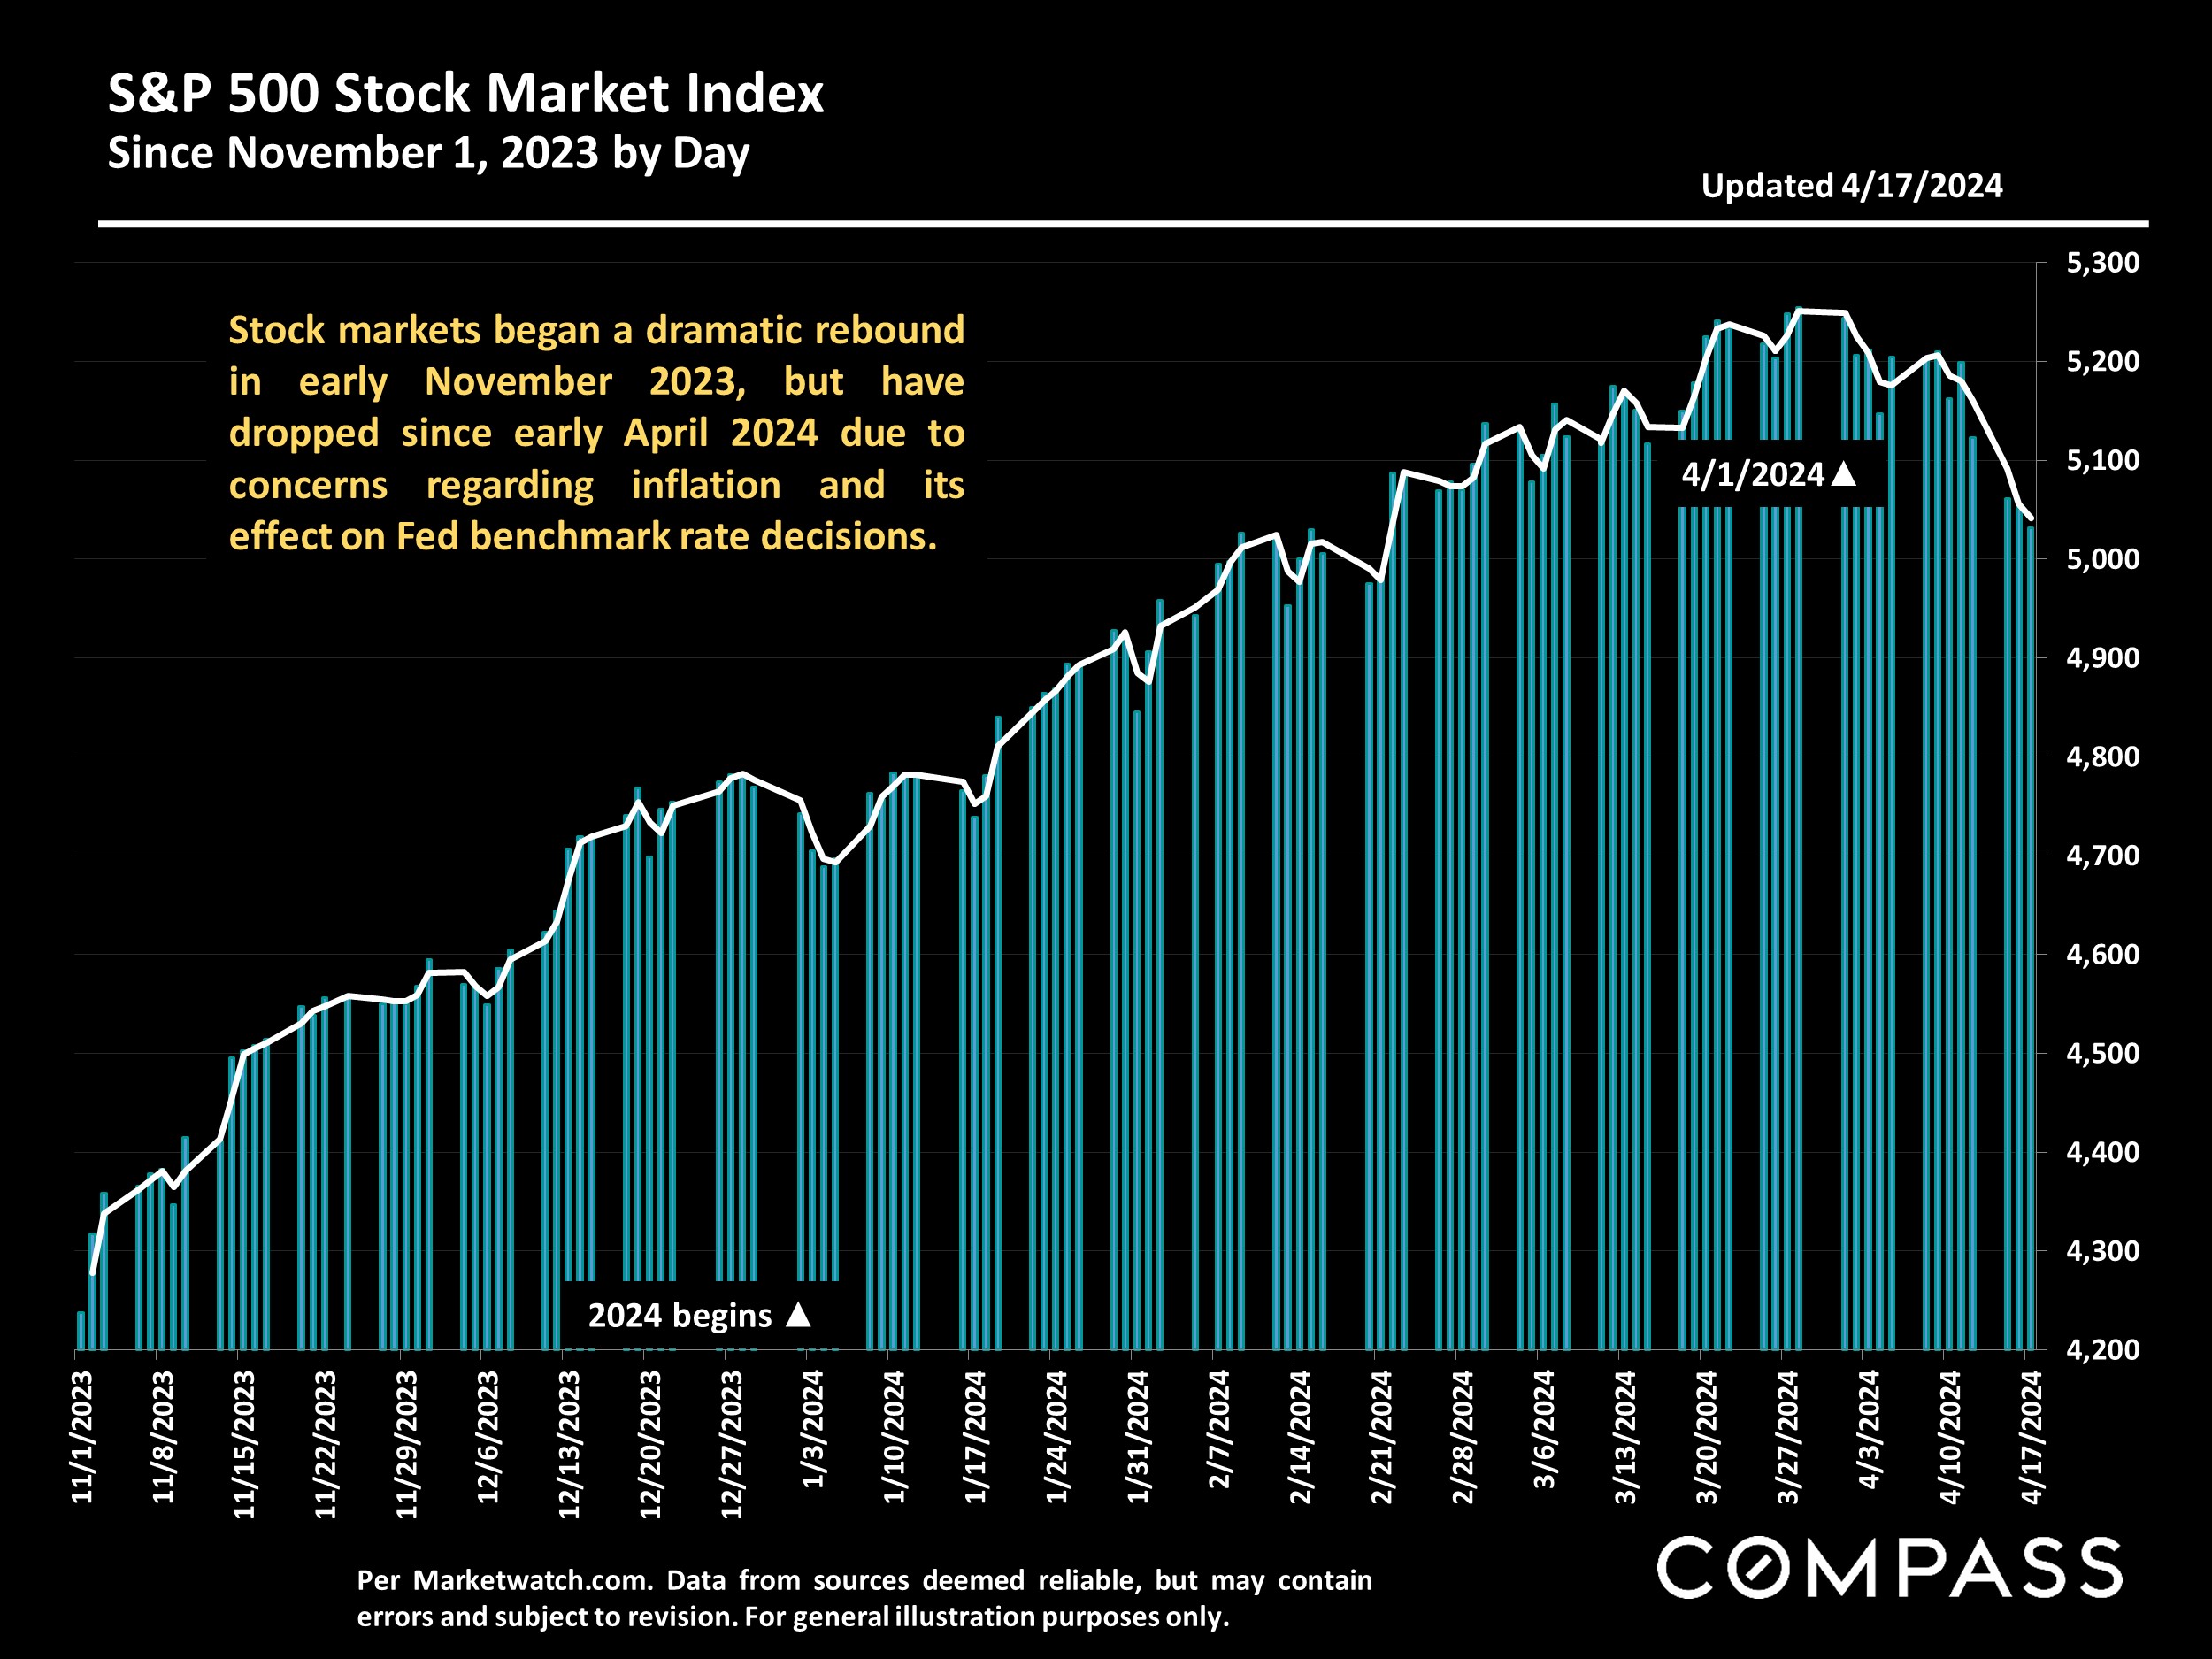
After hitting multiple all-time highs in recent months, stock markets reacted negatively to the latest inflation report and its expected effects on the Fed and interest rates. They remain vastly higher than 5 months ago.
Reach out today if I can ever be of assistance, in any way, to you or your family, friends and colleagues.